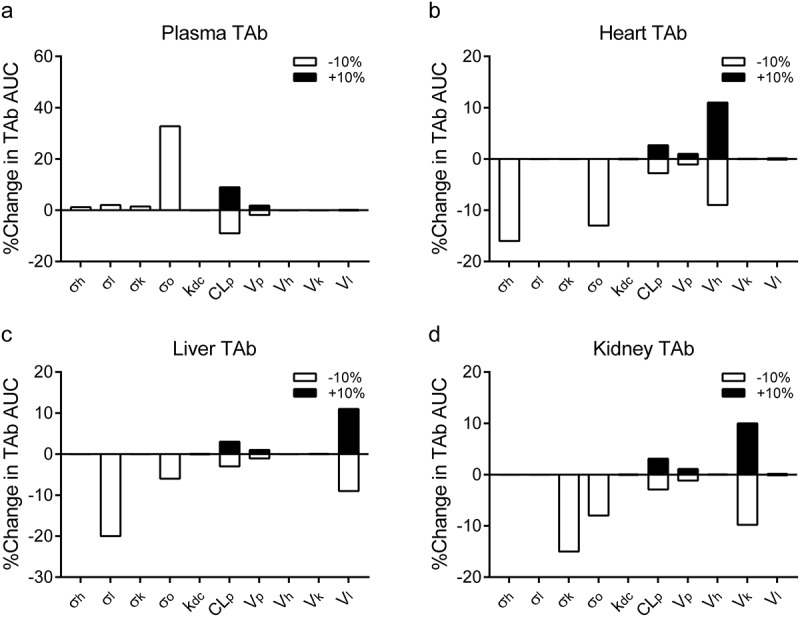
Figure 9.

The plots represent the percent changes of AUC values of TAb in (a) plasma, (b) heart, (c) liver, and (d) kidney samples following ± 10% changes of selected parameter values (i.e., Vascular reflection coefficients (σi, i = heart (h), liver (l), kidney (k) and others (o)), plasma proteolytic clearance of TAC (CLp), deconjugation rate constant (kdc), and tissue physiological volumes (Vi, i = heart (h), liver (l) and kidney (k)). Vascular reflection coefficients (σ) were only tested with −10% changes because + 10% changes resulted in σ > 1. The analysis was performed with simulations at a single IV dose of 50 mg/kg DSTA4637A. Filled and empty bars represent + 10% and −10% changes of parameters, respectively.
