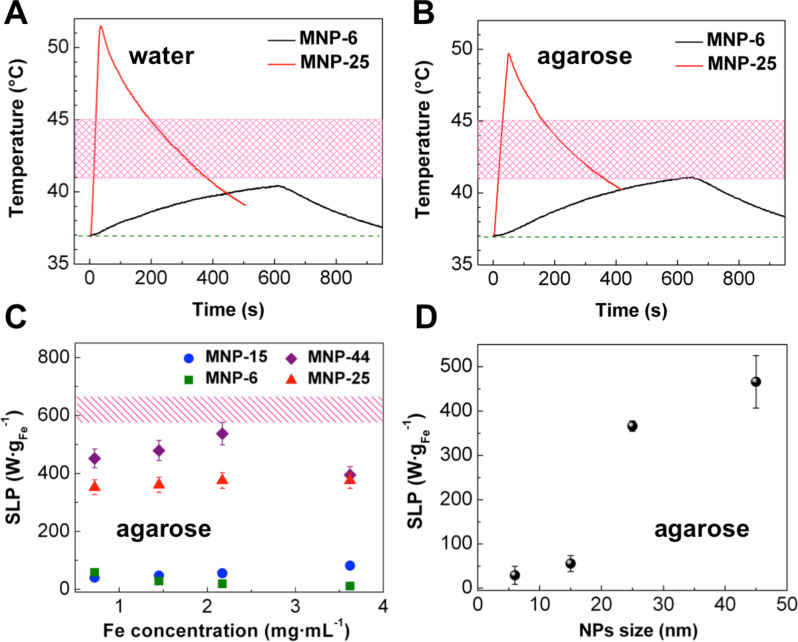
Figure 6.
MPH experiments (765 kHz, 30 mT). The heating curves of MNP-6 and MNP-25 (3.6 mg·mL−1 Fe) in water (A) and agarose (B), the shaded bands show the 41–45 °C region; SLP values for MNP-6, MNP-15, MNP-25 and MNP-44 samples for various concentrations in agarose compared to the reference values for MNP-25 (3.6 mg·mL−1 Fe) in water shown by the shaded band (C); the comparison of concentration-averaged SLP values for the NPs of various size (D). The error bars in (C) and (D) correspond to the standard deviation.

