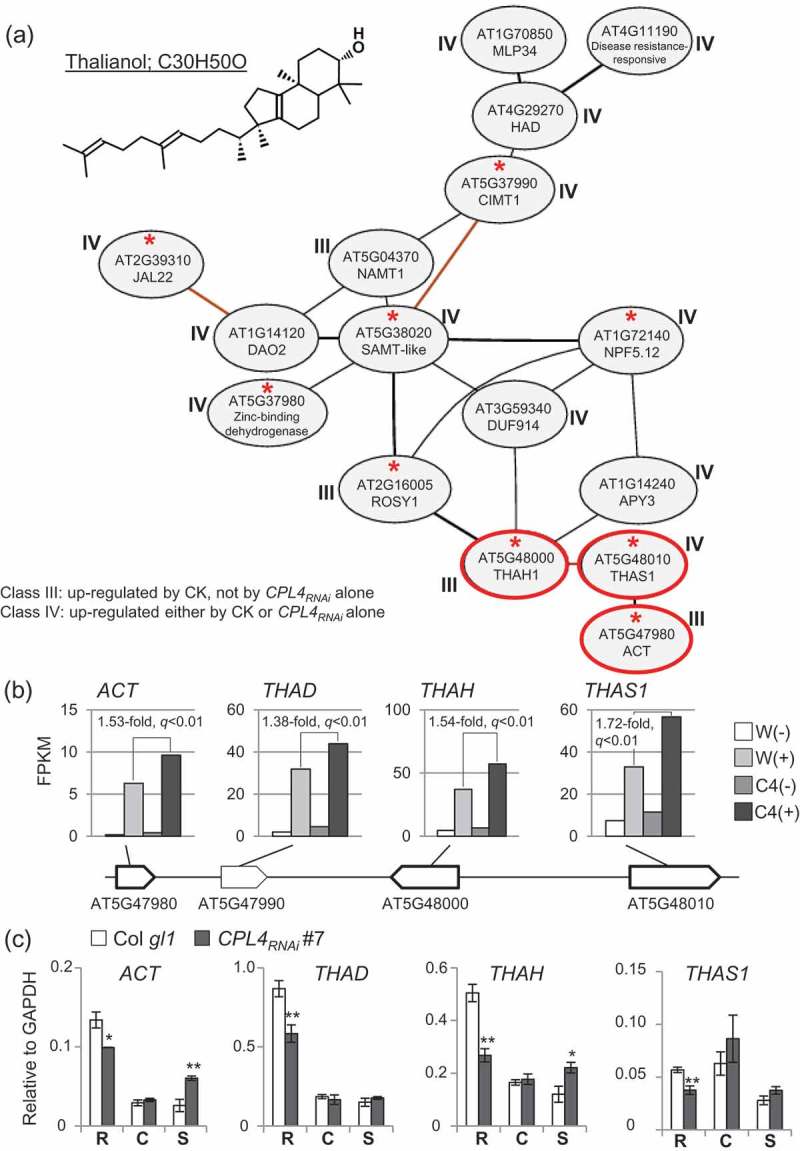
Figure 1.

Thalianol biosynthesis-related co-expression network observed among the 248 genes. (a) A microarray-based (Ath-m) co-expression cluster comprised of more than 10 genes among the 248 genes highly expressed in CPL4RNAi during DNSO, detected by NetworkDrawing tool in ATTED-II ver.9.2 (http://atted.jp/). Genes with a red asterisk show up in the same network based on RNA-seq (Ath-r). An associated class is indicated for each gene. The three genes from a thalianol-biosynthesis operon-like regulon on chromosome 5 are circled in red. The chemical structure of thalianol (C30H50O) is shown, drawn by PubChem Sketcher V2.4, based on the CID25229600. Full name of each gene is described in Abbreviations. (b) FPKM values of the four thalianol biosynthesis genes arranged in an operon-like manner on chromosome 5. C4(+)/W(+) fold change values and associated q-values from Cuffdiff are shown. (c) Expression level of each gene relative to GAPDH [2(Cp of GAPDH – Cp of target)] was measured by RT-qPCR. Roots from 10-day-old seedlings (labeled as “R”) were subjected to CIM pre-incubation for 5 days, then moved to SIM containing 0.05 mg/L 2iP (“S”) for 3 days. Root samples right after the CIM pre-incubation were harvested and denoted as “C”. Bars represent standard error of means from biological triplicates. *p < 0.05, **p < 0.01 by one-tailed Student’s t-test between wild type (Col gl1) and each CPL4RNAi line in each condition.
