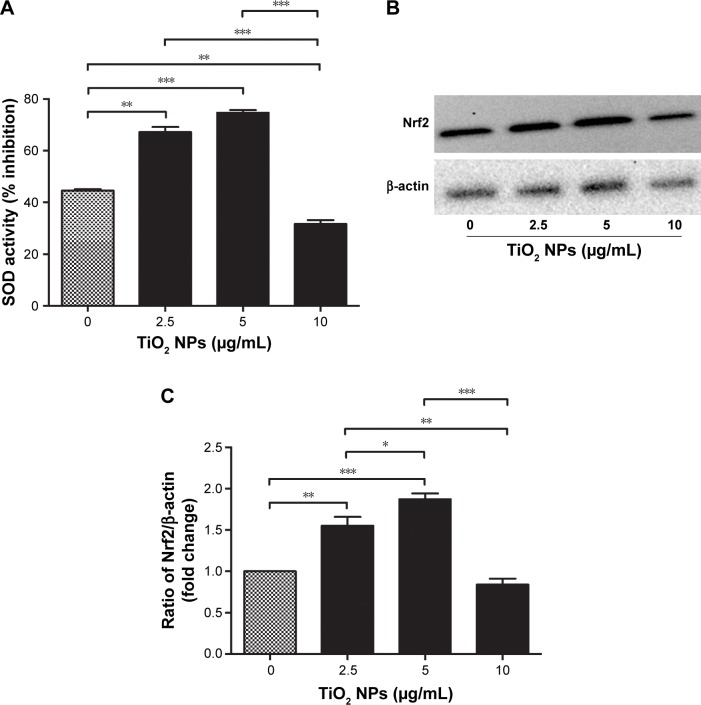
Figure 1.
Effects of TiO2 NPs on the antioxidant defense protein of RAW 264.7 cells.
Notes: (A) SOD enzyme activity; (B) quantitative analysis of relative fold change in Nrf2 protein levels; (C) Western blot image of Nrf2 protein. Cells were incubated with indicated concentrations of TiO2 NPs for 6 hours. Briefly, 20 µg/mL of protein sample was taken and the SOD activity (inhibition rate%) was estimated by BioVision SOD Activity Assay Kit using a multimode microplate reader (DTX-880, Bechman Counter Inc.) at 450 nm. In Western blot, 20 µg/well of protein samples were loaded on 10% SDS-PAGE and transferred to PVDF membrane. Protein blot signals were detected under UVP Biospectrum-600 imaging system (Thermo Fisher Scientific). Protein intensity was quantified using ImageJ. β-Actin antibody was used as control to normalize the data for Western blot. Data are presented as the mean ± standard error of mean; *P<0.05, **P<0.01, and ***P<0.001 indicate significant differences when tested with ANOVA. Tukey’s test was used for post hoc tests.
Abbreviations: TiO2, titanium dioxide; NPs, nanoparticles; Nrf2, nuclear factor erythroid 2-related factor 2; SOD, super oxide dismutase; PVDF, polyvinylidene fluoride.

