Figure 8.
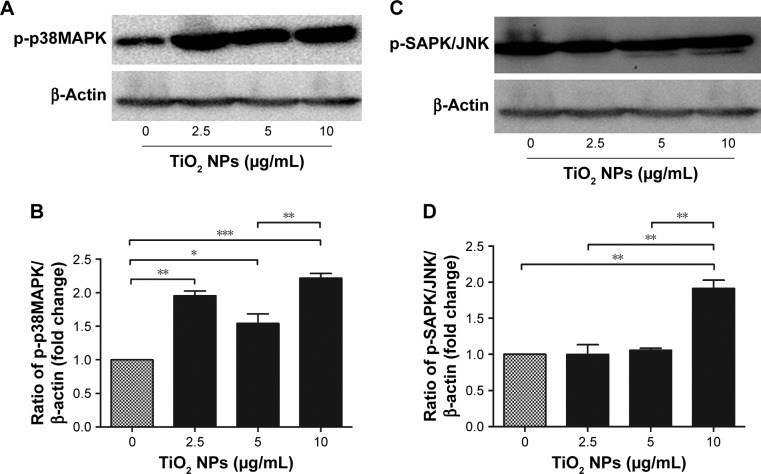
TiO2 NPs triggered activation of MAP kinase signaling cascade.
Notes: (B and D) Quantitative analysis of relative fold changes in p-p38MAPK and p-SAPK/JNK protein levels; (A and C) Western blot images of p-p38MAPK and p-SAPK/JNK protein, respectively. Cells were incubated with indicated concentrations of TiO2 NPs for 6 hours. A 20 µg/well of protein samples were loaded on 10% SDS-PAGE and transferred to PVDF membrane. Protein blot signals were detected under UVP Biospectrum-600 imaging system (Thermo Fisher Scientific, Waltham, MA, USA). Protein intensity was quantified using image processing software ImageJ. Untreated cells were considered as loading control in this experiment. Data are normalized against β-Actin. Data are presented as the mean ± standard error of mean; *P<0.05, **P<0.01, and ***P<0.001 indicate significant differences when tested with ANOVA. Tukey’s test was used for post hoc tests.
Abbreviations: TiO2, titanium dioxide; MAP, mitogen-associated protein; NPs, nanoparticles; PVDF, polyvinylidene fluoride.

