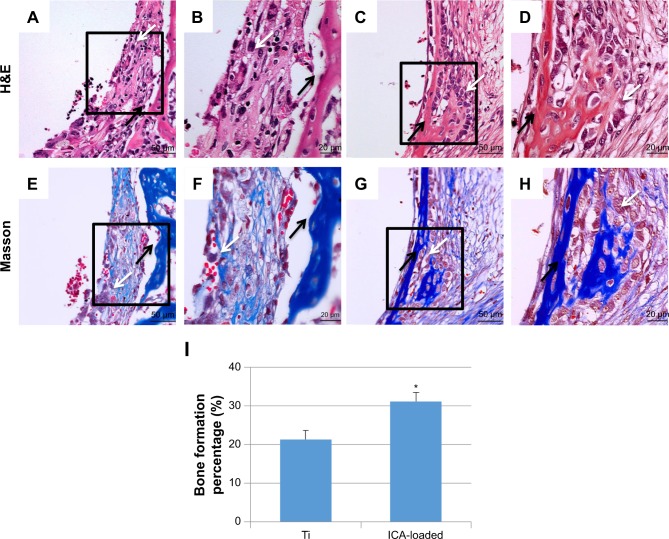
Figure 14.
Histological analysis of the decalcification samples around Ti (A, B, E, F) and ICA-loaded (C, D, G, H) implants was evaluated by H&E (A–D) and Masson (E–H) staining. Histological morphology analyses based on H&E staining after 2 weeks implantation was expressed as was BF % and shown in I.
Notes: B, D, F and H depict zoomed areas of black box in A, C, E and G, respectively. Bars indicate 50 µm (A, C, E, G) and 20 µm (B, D, F, H). The black arrow denotes new bone formation; white arrow denotes osteoblast cell. Data are expressed as mean ± SD (n=3). *A statistical significance compared to the Ti group (P<0.05).
Abbreviations: BF%, area percentage of bone formation; ICA, icariin; Ti, titanium.

