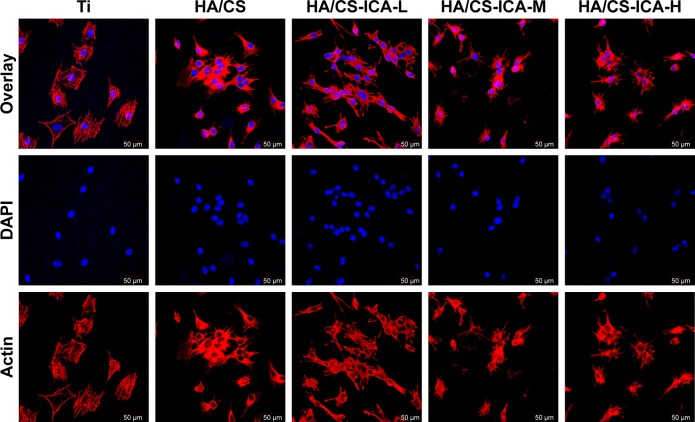
Figure 7.
CLSM images of MC3T3-E1 cells cultured on different surfaces for 24 hours.
Note: Images of cells stained with DAPI to show the nuclei (blue) and rhodamine-phalloidin to show the cytoskeleton (red).
Abbreviations: CLSM, confocal laser scanning microscopy; CS, chitosan; HA, hyaluronic acid; ICA-H, icariin-high dose; ICA-L, icariin-low dose; ICA-M, icariin-middle dose; Ti, titanium.

