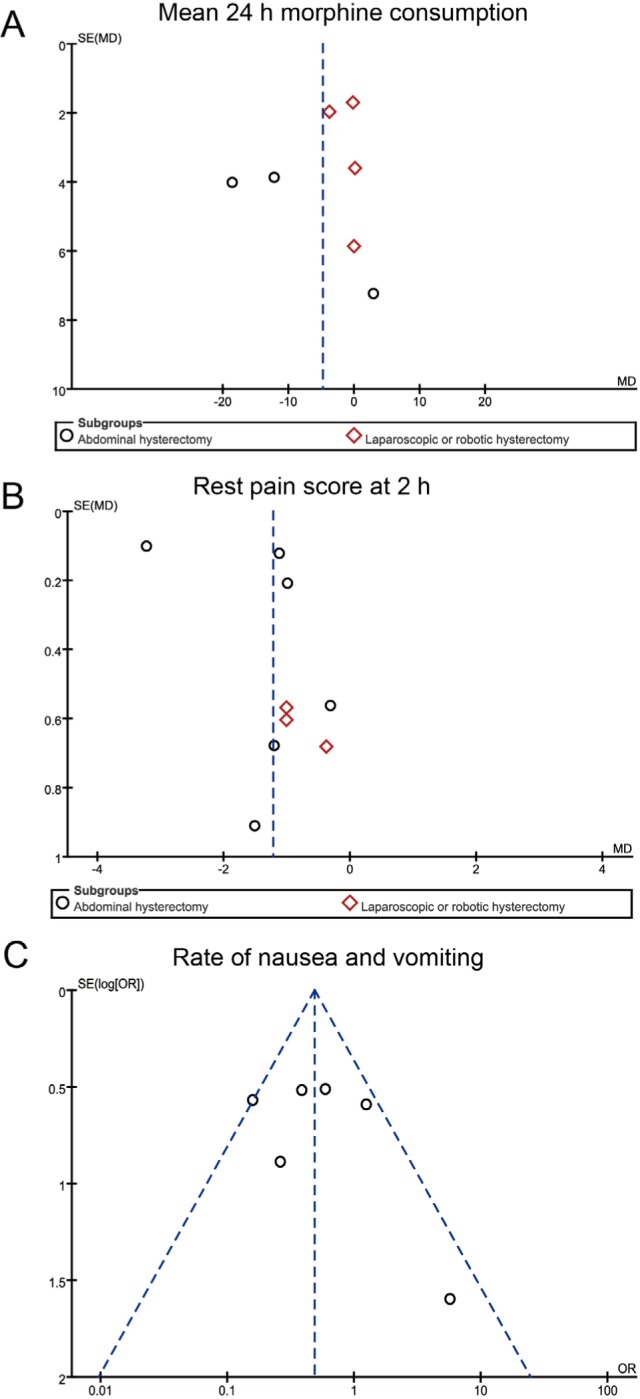
Figure 5.

Representative funnel plots for TAP block group vs control group. Notes: (A) Mean 24-hour morphine consumption; (B) Rest pain score at 2 hours; (C) Rate of nausea and vomiting.
Abbreviations: h, hours; MD, mean difference; SE, standard error; TAP, transver-sus abdominis plane.
