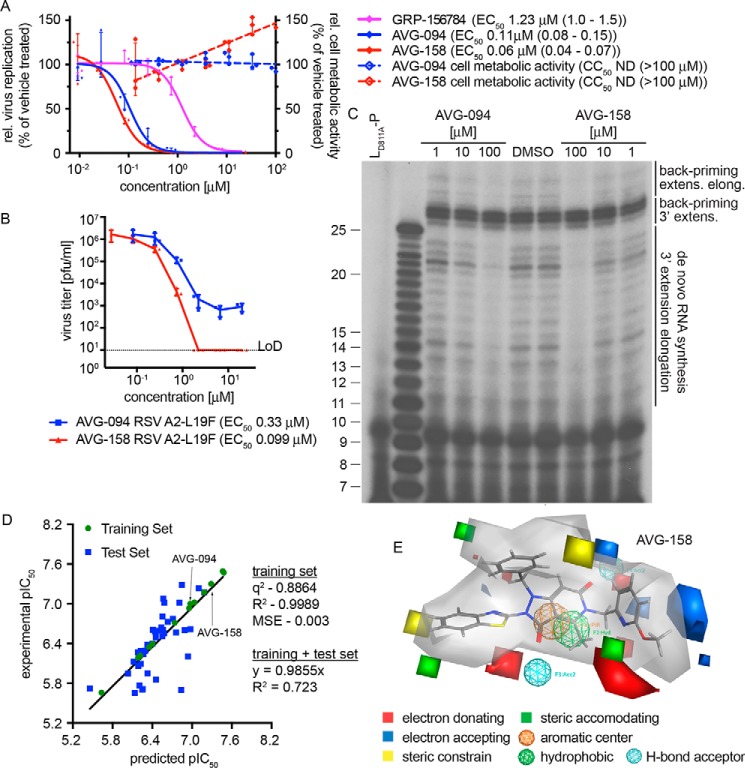
Figure 4.
First-generation optimized leads and 3D-QSAR model for the hit scaffold. A, bioactivity of analogs AVG-094 and AVG-158 compared with resynthesized GRP-156784. No detectable cytotoxicity was measured for either AVG094 (blue dashed line) or AVG-158 (red dashed line). B, reduction of progeny RSV A2-L19F virus load by AVG-094 and AVG-158 determined in dose–response activity assays. Active concentrations were determined through four-parameter variable-slope regression modeling. LoD, level of detection. Symbols in A and B represent individual biological repeats (n = 3 each); error bars, S.D. C, in vitro RSV RdRp activity assay using synthetic template RNA and purified polymerase complexes conducted in the presence of AVG-094 or AVG-158. The compounds show dose-dependent block of 3′ RNA extension elongation after back-priming (back-priming extens. elong.) and de novo RNA synthesis from the promoter, but do not prevent extension by up to three nucleotides after back-priming (back-priming 3′ extens.). LD811A is bio-inactive due to the alanine substitution in the L catalytic site and was included as assay specificity control. D, generation and testing of a 3D-QSAR model developed based on a subset of GRP-156784 analogs synthesized for chemical optimization of the scaffold. AutoGPA embedded in the MOE package was used for model building. Predicted (x axis) and experimentally measured (y axis) pIC50 value correlations are shown. Values denote predictive capacity, goodness of fit, and, for the combined training and test sets, slope through the origin. E, graphical representation of the 3D-QSAR model from D. Gray shading, allowable space component of the model. Areas of steric constraints, steric freedom, electro-activity, and hydrophobic interactions are shown. Electrostatically active regions of the compound are shown in red and blue.

