
Figure 5.
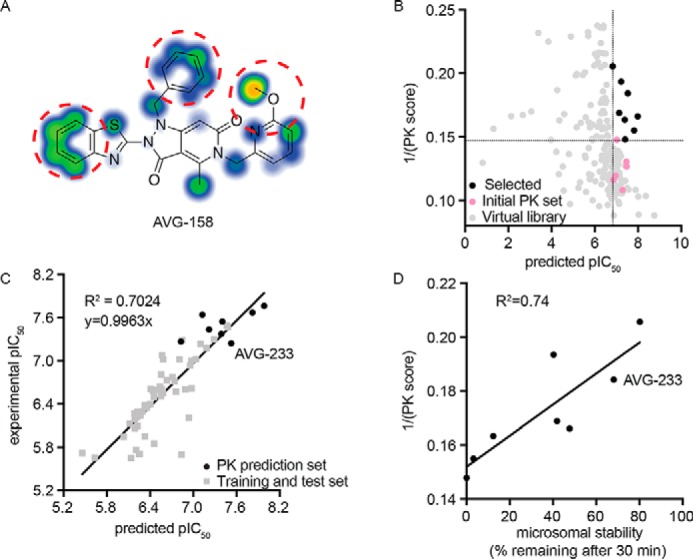
3D-QSAR-informed optimization of select PK properties of the scaffold. A, metabolic stability predictions for the AVG-158 analog using SMARTCyp. Areas of high postulated metabolic susceptibility (red circles) against eight isoforms of cytochrome P450 are shown. Potential metabolic liabilities are color-coded from moderate (blue) to severe (orange). B, virtual library screen to optimize metabolic properties. Shown are predictions for six experimentally tested compounds (pink), virtual library entries (gray), and virtual library entries selected for synthesis (black). Dotted lines, cutoff criteria for chemical synthesis (predicted pIC50 and metabolic stability at least equal to that of the least potent (predicted pIC50 > 6.8) and most stable (1/PK score >0.147) experimentally analyzed analog, respectively). C, correlation of bioactivities predicted by the 3D-QSAR model (x axis) and experimentally measured (y axis) for the synthesized eight virtual screening hits selected in B. D, correlation between experimentally measured human microsome stability (x axis) and predicted metabolic susceptibility (y axis) for these eight virtual screening hits. The second-generation lead candidate AVG-233 is highlighted in C and D.