Figure 1.
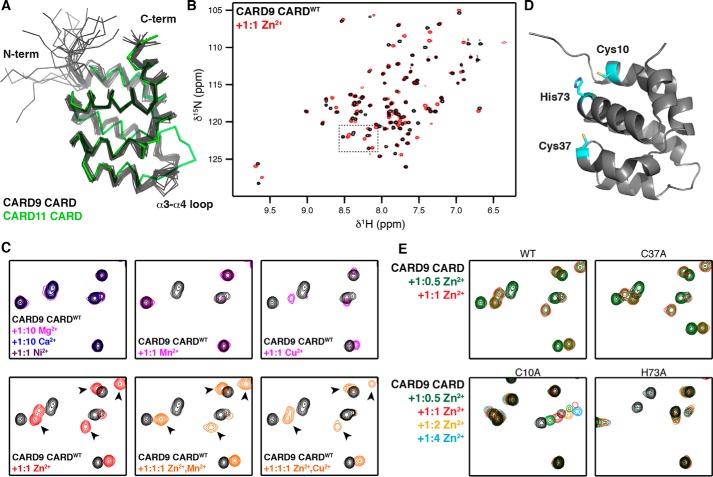
CARD9–CARD binds Zn2+. A, ribbon diagram of the 20 lowest energy structures calculated for the apo-CARD9–CARD (black), aligned with the crystal structure of the CARD11–CARD (PDB code 4I16, green). B, 15N HSQC spectra of the CARD9–CARD in the absence (black) and presence (red) of equimolar ZnCl2. Dashed line box indicates region expanded in C and E. C, top row, selected region of CARD9–CARDWT 15N HSQC spectra apo or with equimolar CaCl2, MgCl2, NiCl2, MnCl2, or CuCl2. Bottom row, selected region of CARD9–CARDWT 15N HSQC spectra apo or with equimolar ZnCl2, equimolar ZnCl2 and MnCl2, or equimolar ZnCl2 and CuCl2. Arrowheads indicate examples of peak positions unique to the Zn2+-bound state. D, lowest energy CARD9–CARD structure with the potential Zn2+-coordinating residues highlighted in cyan. E, selected region of CARD9–CARDWT and CARD9–CARDC37A 15N HSQC spectra with 1:0 (black), 1:0.5 (green), and 1:1 (red) ZnCl2, demonstrating slow exchange dynamics. CARD9–CARDC10A and CARD9–CARDH73A are shown with 1:0 (black), 1:0.5 (green), 1:1 (red), 1:2 (orange), and 1:4 (blue) ZnCl2, demonstrating a shift to the intermediate-to-fast exchange regime.

