Figure 4.

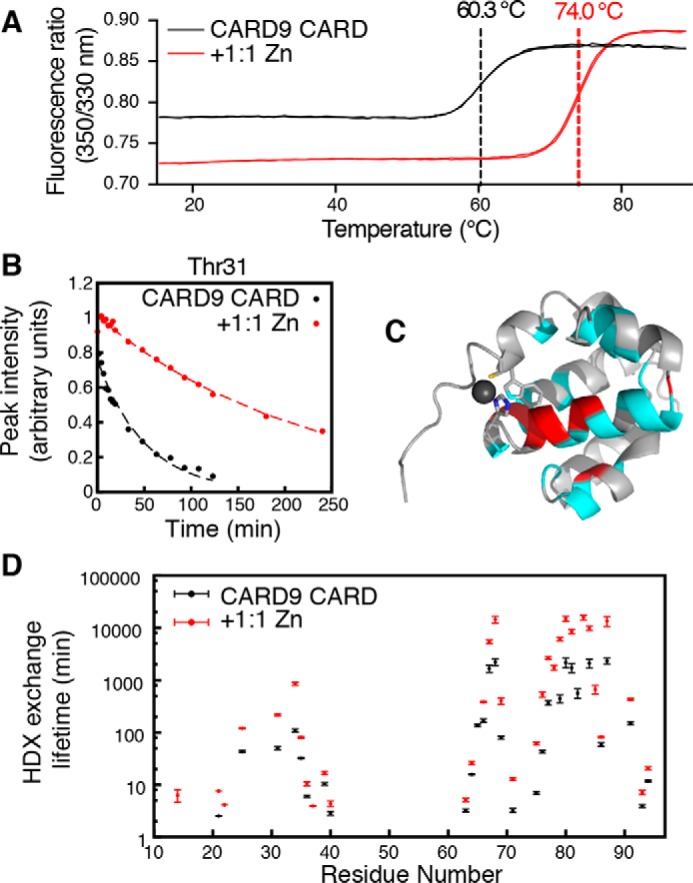
Zn2+ binding stabilizes the CARD9–CARD and slows HDX. A, differential scanning fluorimetry melt curve for apo (black) and Zn2+-bound (red) CARD9–CARD. Inflection points are indicated by dashed vertical lines. Two technical replicates are shown for each condition, which agreed to within 0.1 °C of the mean values shown on the graph. B, representative NMR HDX peak-height decay curve for Thr-31 in the absence (black) and presence (red) of equimolar Zn2+. Circles represent 15N-SOFAST-HMQC peak intensities, and dotted lines are best-fit single exponential decay curves. C, CARD9–CARD, lowest energy Zn2+-bound solution structure. Residues for which Zn2+ binding increased the HDX lifetime, which includes all observed peaks, are colored cyan. The indole amide of Trp-11 also exhibits enhanced protection and is colored cyan. Those residues for which lifetimes could be calculated in both the apo and Zn2+-bound states and were increased greater than 5-fold by Zn2+ binding are colored red. D, global CARD9–CARD backbone amide HDX exchange lifetimes in the absence (black) and presence (red) of equimolar ZnCl2. Error bars represent profile likelihood 95% confidence intervals. Residues are excluded for which no signal remained at the first time point or for which overlap precluded accurate peak height determination.
