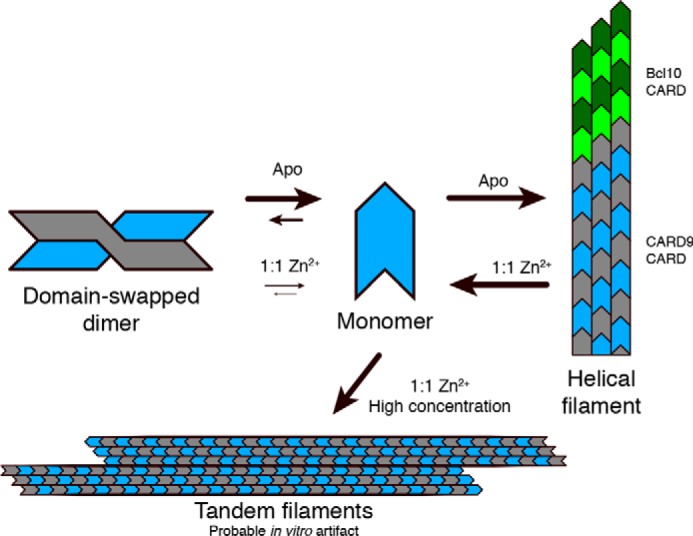
Figure 7.

Cartoon depiction of the observed conformational states of the CARD9–CARD. CARD9–CARDs are depicted in gray and blue with arrows qualitatively indicating the impact of Zn2 binding on the various transitions. Bcl10 CARDs are depicted in green.
