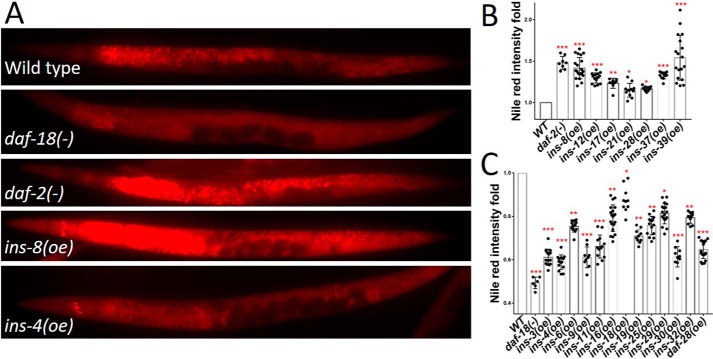
Figure 5.
ins (oe) functions on fat accumulation. A, fat accumulation analyzed by Nile Red staining in WT, daf-18(−), daf-2(−), and ins (oe) worms. The daf-2 and daf-18 mutants have higher and lower level fat accumulation than WT, respectively. B, 7 ins (oe) worms (antagonists) have higher fat accumulation than WT. C, 13 ins (oe) worms (agonists) have lower fat accumulation than WT. Error bars represent the S.D., *, p value (t test) versus control <0.05; **, p value (t test) versus control <0.01; ***, p value (t test) versus control <0.001. Also see details Table S5.

