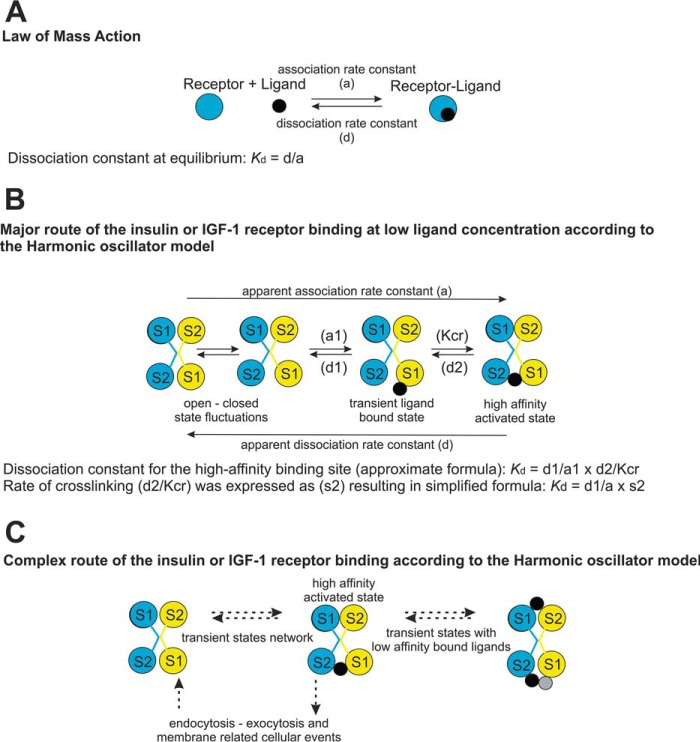
Figure 5.
Simplified scheme of receptor–ligand interaction models used for interpretation of kinetic measurements. A, the law of mass action model; B, harmonic oscillator model, adapted from (6, 7) of insulin or IGF-1 binding at low ligand concentration, where a1 is the association and d1 is the dissociation coefficient of Site 1 (S1); d2 is the dissociation coefficient of Site 2 (S2), and Kcr is a constant characterizing the Site 1 and Site 2 assembly to form the high-affinity complex. C, model of insulin or IGF-1 receptor binding. Multiple factors influencing the kinetics are suggested. Receptors are represented by a blue circle or an assembly of blue and yellow circles showing binding sites on IR or IGF-1R homodimers. Black circles, ligands; gray circle, third ligand molecule bound to the IR, which is not allowed on IGF-1R.

