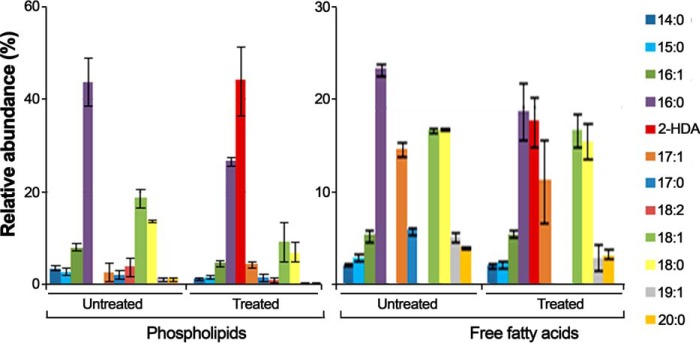
Figure 1.
Composition of phospholipid fatty acids and free fatty acids in E. coli after exposure to 2-HDA. E. coli cells were grown at 37 °C for 18 h in LB broth containing 50 μg/ml 2-HDA (Treated) or in its absence (Untreated). Fatty acids were eluted, converted to methyl esters and analyzed by GC-MS) as described under “Experimental procedures.” Bars represent the relative abundance of different fatty acids obtained from three separated experiments (mean ± S.D.). Fatty acid nomenclature indicates the number of carbons followed by the number of double bonds.

