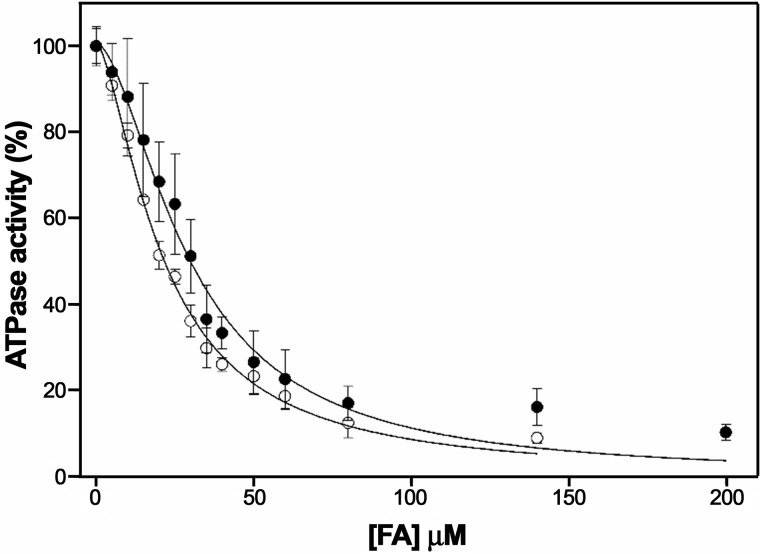
Figure 3.
Determination of the kinetic parameters of inhibition by 2-bromopalmitic acid. ATP hydrolysis by TrwD (2 μm) was measured at increasing concentrations of 2-bromopalmitic acid (white circles) and compared with the values obtained at increasing concentrations of 2-HDA (black circles) (8). Data were fitted to a Hill inhibition equation (error bars indicate S.D.).

