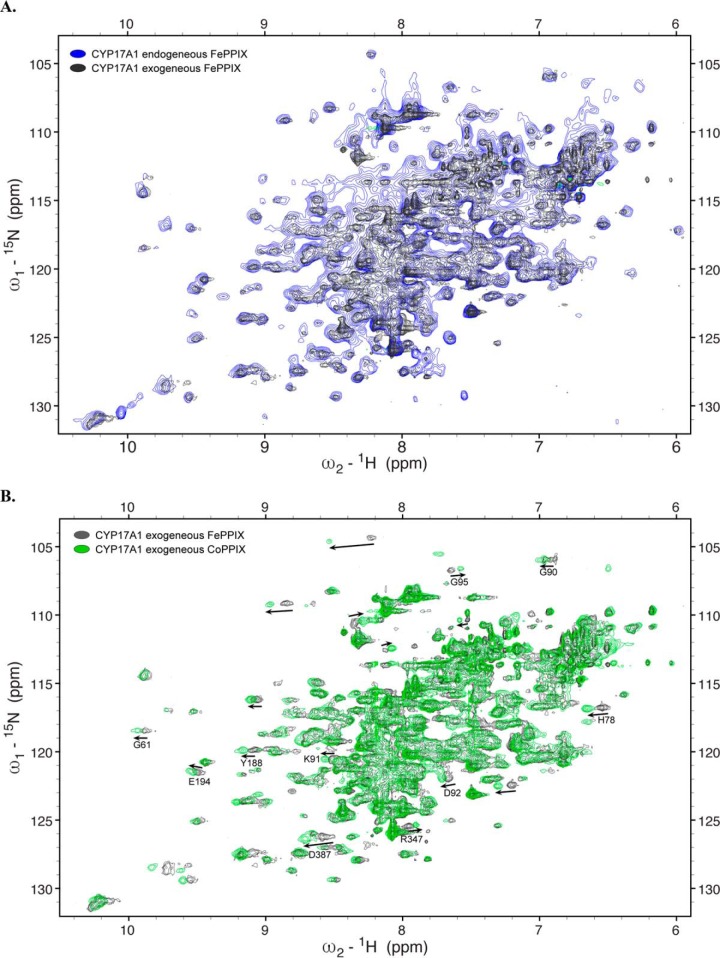
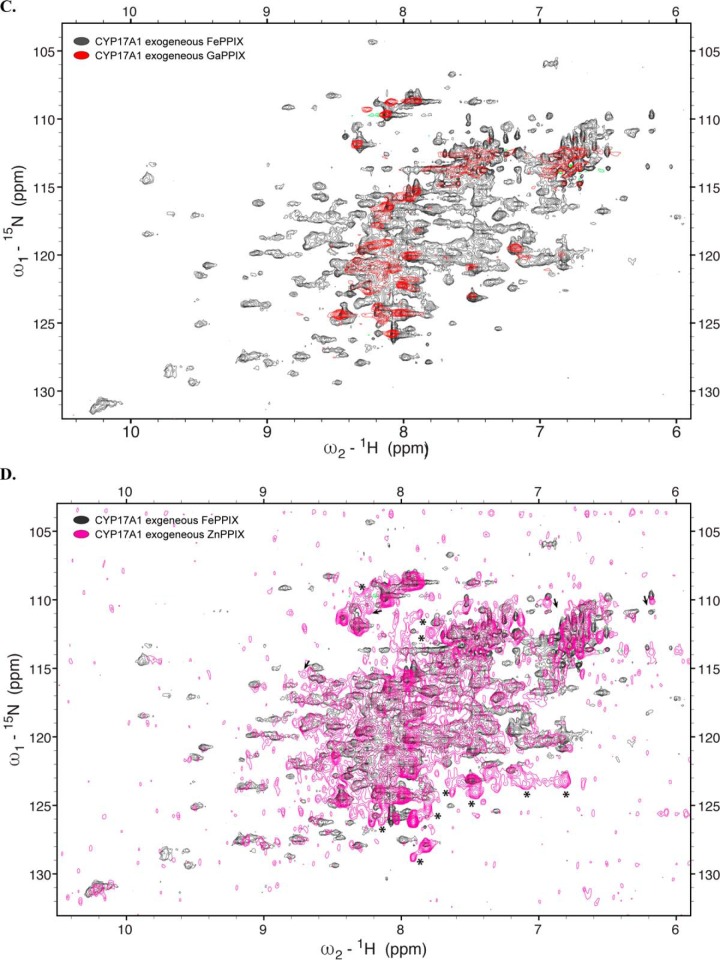
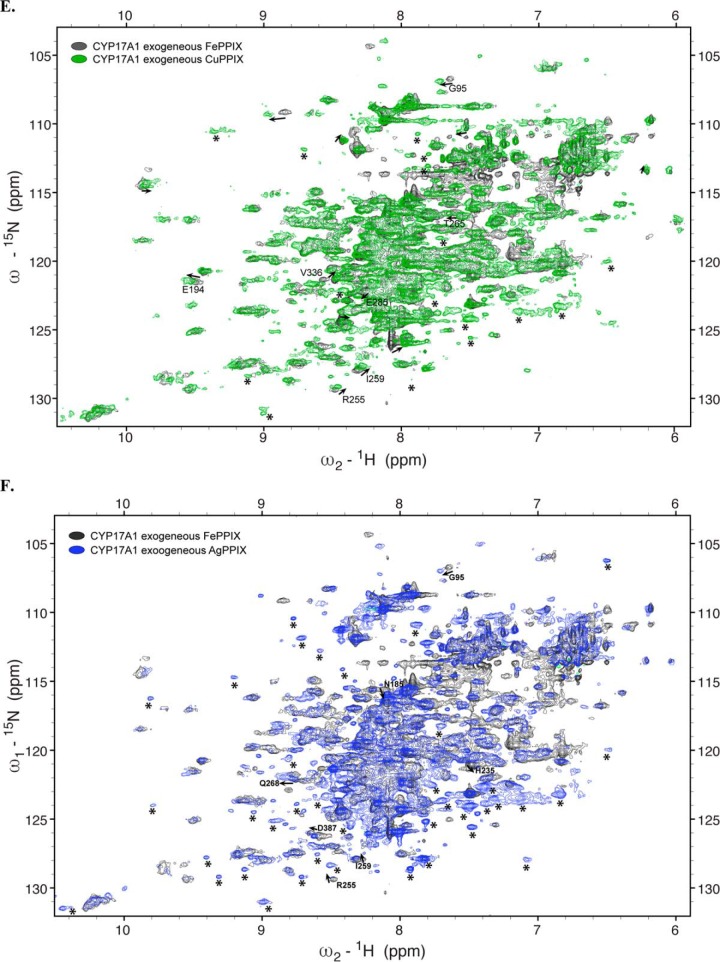
Figure 3.
Overlay of 1H-15N TROSY-HSQC spectra of CYP17A1 expressed under various conditions. A–F, expression with exogenous FePPIX supplementation and pHUG genes (gray) versus δ-aminolevulinic supplementation supporting endogenous FePPIX biosynthesis (blue) (A), CoPPIX (green) (B), GaPPIX (red) (C), ZnPPIX (magenta) (D), CuPPIX (green) (E), or AgPPIX (blue) (F). Arrows, shifted resonances. Asterisks, peaks that can be detected in metal-substituted samples but not in the native FePPIX samples.


