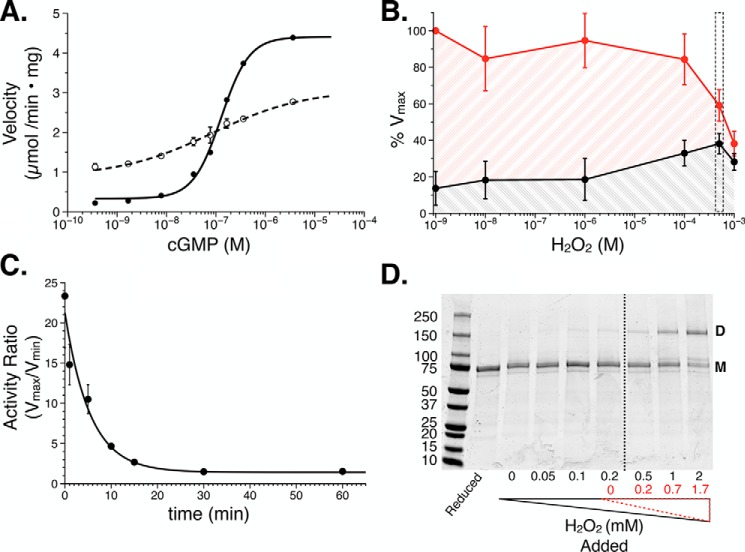
Figure 2.
Initial characterization of the PKG Iα oxidative phenotype. A, cGMP-dependent activation under reducing (solid line; n = 12) and oxidizing (500 μm H2O2, 30 min; dashed line; n = 16) conditions. B, PKG Iα activity plotted against increasing concentrations of H2O2. Activity was measured in the absence (black; n = 4) and presence of cGMP (red; 4 μm, n = 4). The concentration of H2O2 (500 μm) that resulted in the greatest increase in basal activity is highlighted in the boxed region. C, time course examining PKG Iα oxidation with 500 μm cGMP wherein the -fold activity (Vmax/Vmin) was monitored (n = 4). D, representative nonreducing, denaturing SDS-PAGE of PKG Iα exposed to increasing concentrations of H2O2. The dashed line indicates the point at which the concentration of hydrogen peroxide overcomes the concentration of TCEP in the buffer. H2O2 values corrected for the presence of TCEP are shown in red. Where shown, data are represented as the mean ± S.D. (error bars).

