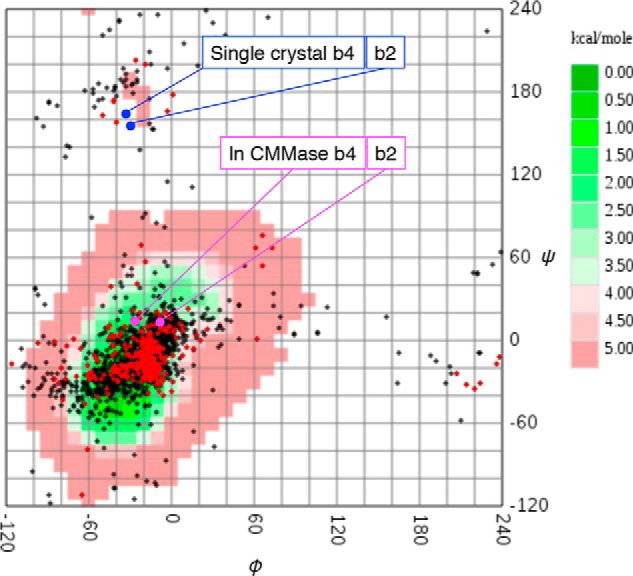
Figure 9.

α-1,4-Glycosidic bond torsion angles of α-maltose units in PDB (GlycoMAP ID: 7565) and CMM structures. Exact α-maltose structures (red) and α-maltose-containing glycans (black) in the PDB are plotted on a calculated conformational free energy map (coded green to red for low- to high-energy conformations). The torsion angles of CMM molecules in the single crystal (blue) and in the CMMase complex structure (magenta) are also plotted. The b2 and b4 bonds of CMM are designated in Fig. 4.
