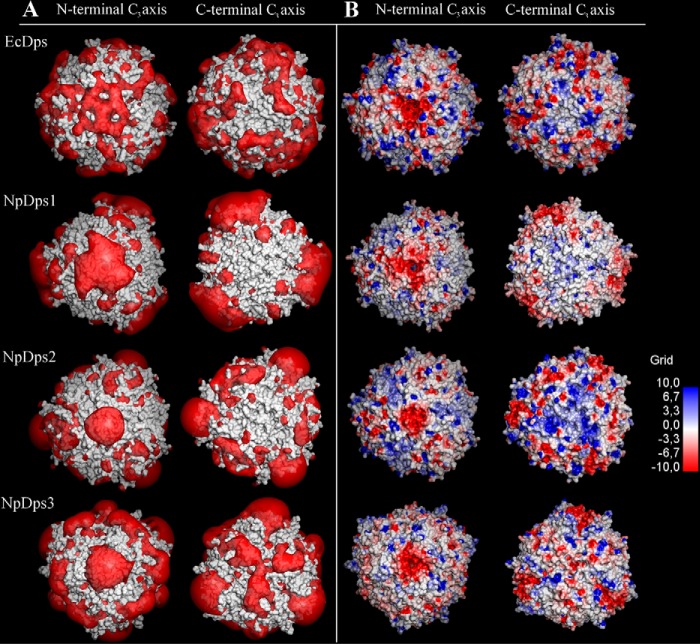
Figure 5.
Calculated electrostatic potential around the N- and C-terminal C3-axes in E. coli Dps (EcDps) and the model structures of NpDps1, NpDps2, and NpDps3. A, electrostatic potential isosurfaces (red; −1.0 kT/e) of the Dps proteins, superimposed onto the van der Waals surface of the proteins (gray). B, the van der Waals surfaces of the Dps proteins colored according to the calculated electrostatic potentials from electronegative (red) to electropositive (blue) by a continuous color gradient. The N-terminal C3-axes indicates the ferritin-like pore and the C-terminal C3-axes indicates the Dps-type pore.

