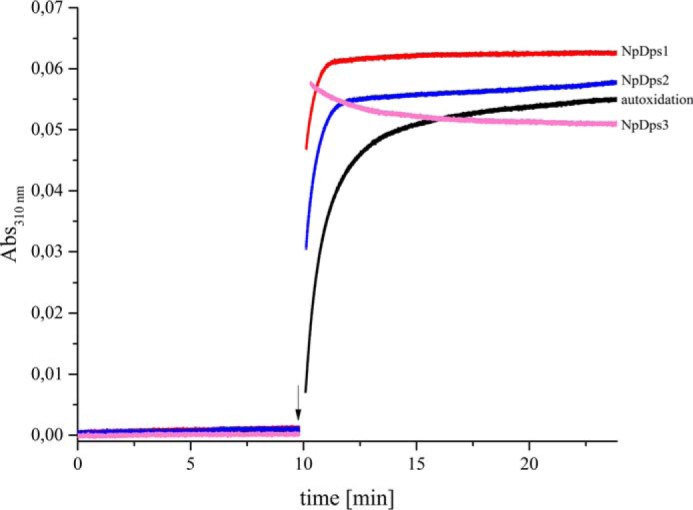
Figure 6.

Fe2+ oxidation kinetics in the presence of NpDps1, NpDps2, and NpDps3. Absorbance measured at 310 nm corresponds to the formation of the ferric iron in the presence of NpDps1 (red line), NpDps2 (blue line), NpDps3 (pink line), and for the no protein control (black line). 0.5 μm of each NpDps protein was mixed with 24 μm Fe2+ (48 iron ions per Dps dodecamer), at time 0 min and the absorbance was analyzed for 10 min, before addition of 16 μm H2O2 as indicated by the arrow. Reactions were performed in 5 mm succinate buffer, pH 6.0, 50 mm NaCl, at room temperature and under aerobic conditions.
