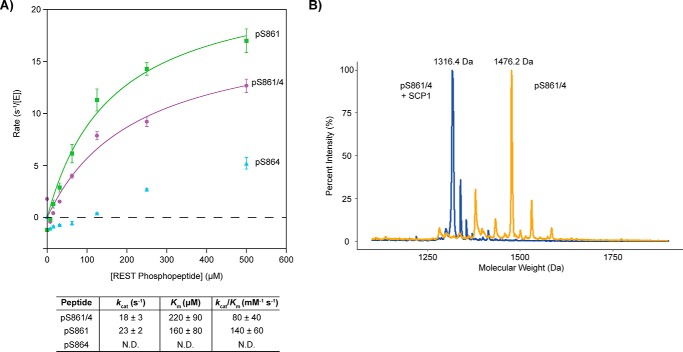
Figure 1.
Dephosphorylation of REST(858–869)-phosphorylated peptides by SCP1. A, SCP1 dephosphorylation rates against the pSer-861 (green), pSer-864 (light blue), and pSer-861/864 (purple). REST peptide reactions were determined in triplicate with error bars indicating S.D. between rate values from the independent reactions. The specificity constants (kcat/Km) from fitting the pSer-861 (green) and pSer-861/864 (purple) curves are indicated in the table below. Kinetic parameters for pSer-864 (light blue) were not determined (N.D.) due to low activity. B, MALDI-TOF spectra of the pSer-861/864 REST peptide untreated (orange) or treated with SCP1 (blue). Mass labels have been indicated for the peaks of maximum intensity in each sample. The predicted molecular weight of the pSer-861/864 peptide is 1477.5 Da, which corresponds to the major peak of the MALDI trace for the untreated peptide (1476.2 Da). There is a loss of 159.8 Da in the major peak of the SCP1-treated reaction compared with the major peak in the untreated reaction (molecular mass of PO3 is ∼80 Da).

