
Figure 1.
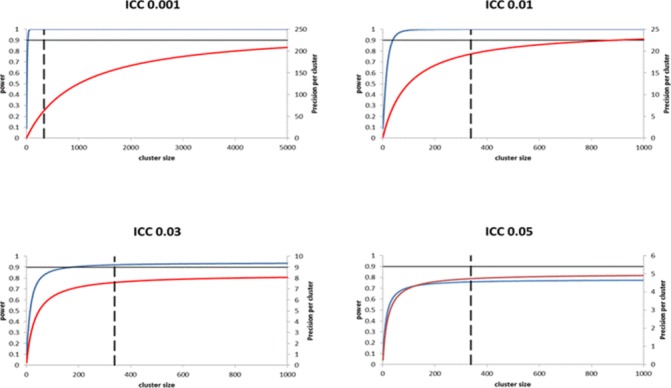
Illustration of diminishing returns in precision as cluster size increases, for typical intracluster correlation coefficient (ICC) values. Curves show increases in power (blue line) and precision (red line) as cluster size increases. All power curves correspond to a cluster randomised trial with 12 clusters per arm, designed to detect a standardised effect size of 0.25. At a significance level of 5%, 338 individuals per arm are required to yield 90% power under individual randomisation. Precision curves are independent of effect size (assumed to be continuous outcome). Dashed lines represent required sample size per arm under individual randomisation.