
Figure 2.
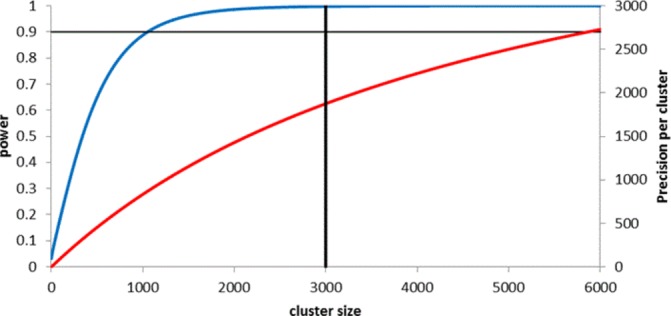
Power and precision curves for ASCEND trial. Curves show increases in power (blue line) and precision (red line) as cluster size increases, assuming a cluster randomised trial with 25 clusters per arm, designed to detect a standardised effect size of 0.04, at a significance level of 5% (which requires a sample size of 13 500 per arm under individual randomisation), and assuming an intracluster correlation coefficient of 0.0002. Vertical solid line represents cluster size in the study (3000). Full details of calculations are provided in online supplementary appendix 1.