Figure 3.
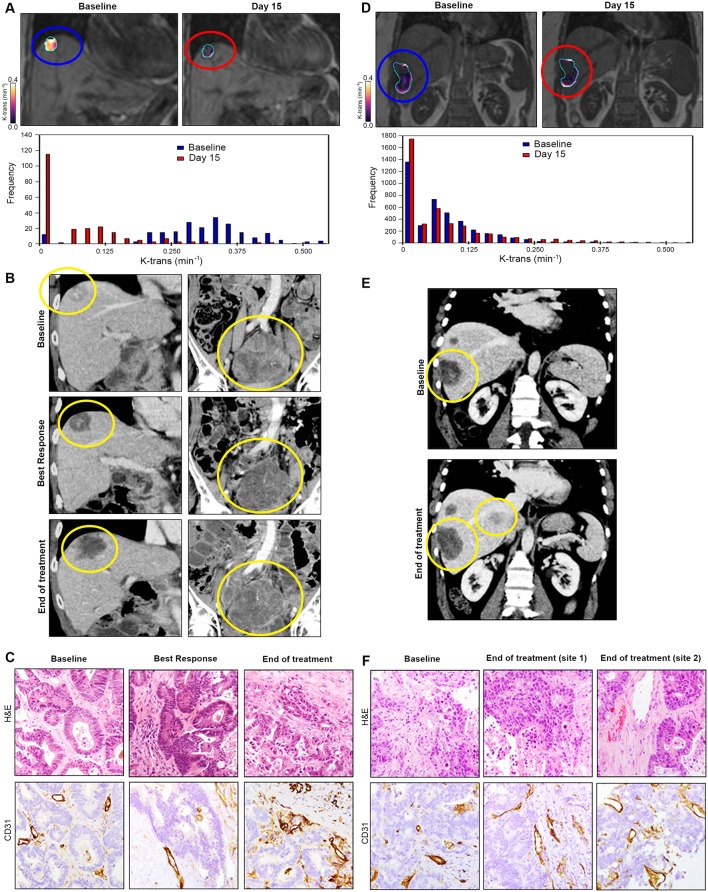
Correlation between radiological and pathological findings in the PROSPECT-R trial. Panels A–C demonstrate an example of a patient with durable disease control of 14 months, while panels D–F show example of a primary resistance patient (2 months). (A) Coronal DCE-MRI (central slice of a liver lesion) showing significant reduction in the median Ktrans(min−1) with accompanying histogram (whole lesion) at day 15 post-treatment. (B) Coronal CT images at baseline, best response (2 months) and at the end of treatment (14 months) for same liver lesion (left) and an abdo-pelvic mass (right). Patient achieved stable disease by RECIST V.1.1. (C) Matched IHC analysis demonstrating decrease and subsequent increase in tumour vascularity measured by staining CD31 at 2 and 14 months, respectively. (D) Coronal DCE-MRI and accompanying histogram of the liver lesion showing no significant reduction in the median Ktrans(min−1) at day 15 post-treatment. (E) Coronal CT images of the liver showing progression (30% increase) of the same target liver lesion (yellow circle) at baseline and at progression (2-month scan). (F) Matched IHC analysis demonstrating no change in tumour vascularity measured by staining CD31 at 2 months. Two separate progressive disease lesions were analysed to take into account tumour heterogeneity; however, no change in vascularity was observed in either of the biopsied lesion. CT, computed tomography; DCE, dynamic contrast enhanced; IHC, immunohistochemistry.

