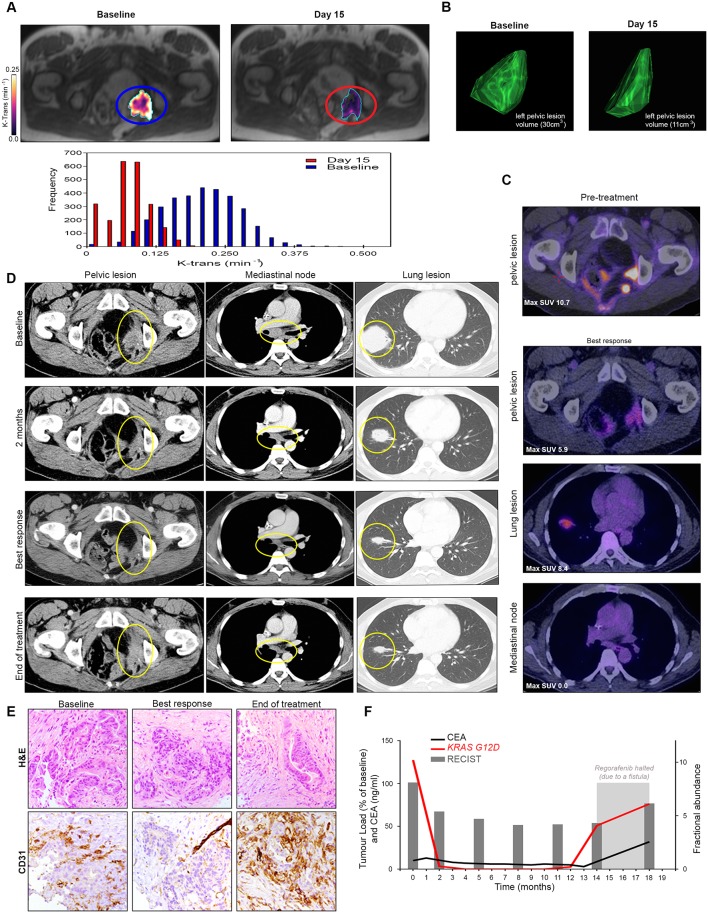
Figure 4.
Correlation between radiological, pathological and circulating biomarkers in PROSPECT-R trial. (A) Axial DCE-MRI demonstrating significant reduction (71%) of the median Ktrans(min−1) in the left pelvic wall recurrence, with accompanying histogram at day 15 post-regorafenib. (B) Three-dimensional representation of target lesion by CT performed at baseline and at week 31 (best response) demonstrating reduction in lesion volume. (C) FDG-PET images performed at 4 months of therapy showing residual FDG uptake, although significantly less when compared with a historic PET-CT performed 18 months prior to regorafenib therapy. (D) Axial CT images demonstrating a maintained RECIST V.1.1 partial response (45%) to regorafenib for 31 weeks. Images show representative sites of disease including left pelvis side wall, mediastinal lymphadenopathy and large lung metastases (yellow circles). Note is made that at the time of progression, left pelvic side wall disease progressed (28%), while the remaining disease had maintained partial response demonstrating the intertumoural heterogeneity in resistance to regorafenib. (E) Matched IHC analysis demonstrating decrease and subsequent increase in tumour vascularity measured by staining CD31 at 2 and 12 months, respectively. (F) Graphical representation of clonal KRAS mutation tracked by digital droplet PCR analysis of circulating tumour DNA analysis compared with CEA and total volume of target lesions measured RECIST V. 1.1 assessment. This demonstrates that an early drop and rise in fractional abundance of KRAS mutation that precedes changes in CEA, both at response and resistance to regorafenib. CEA, carcinoembryonic antigen; DCE, dynamic contrast enhanced; FDG-PET, 18 Fluoro-deoxyglucose positron emission tomography; IHC, immunohistochemistry; MRI, magnetic resonance imaging.

