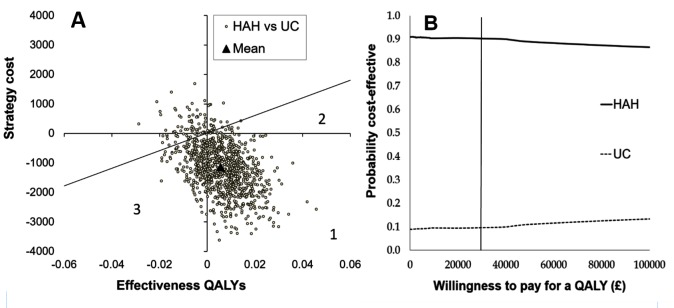
Figure 3.
Cost-effectiveness plane (A) and cost-effectiveness acceptability curve (B). The cost-effectiveness plane for HAH and UC, with the diagonal line representing the NICE cut-off at £30 000 per QALY. Area 1=HAH cheaper and more effective; area 2=HAH more effective and more expensive but less than the NICE cut-off; and area 3=UC is more effective but more expensive and exceeds the NICE cut-off. (B) The probability of cost-effectiveness is shown over a range of willingness to pay for a QALY, to inform decisions to accept or reject new technologies. There is a 90% probability HAH will be cost-effective at the NICE threshold (vertical line). HAH, Hospital at Home; NICE, National Institute for Health and Care Excellence; QALY, quality-adjusted life year; UC, usual care.

