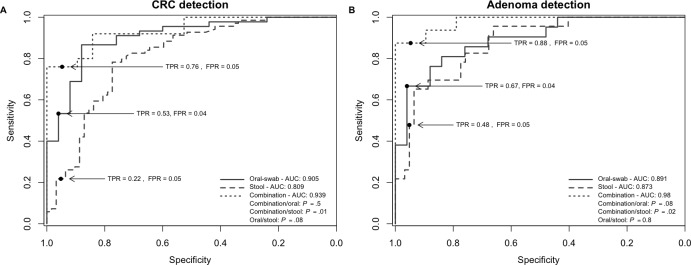
Figure 2.
Oral and stool microbiota profiles are potential tools for the detection of CRC. (A and B) Receiver operating characteristic curves (ROC) and area under the curve (AUC) values for the prediction of CRC (A) and polyps (B) using microbiota profiles from oral swabs, stool or a combination of both. AUC values were highest for the combination test. Significance determined after DeLong (Materials and Methods). Sample numbers: swabs: n=25 (healthy controls), n=45 (CRCs), n=21 (polyps); stool: n=62 (healthy controls), n=69 (CRCs), n=23 (polyps); and combination: n=19 (healthy controls), n=25 (CRCs), n=16 (polyps). CRC, colorectal cancer; FPR, false-positive rate; TPR, true-positive rate.

