Figure 5.
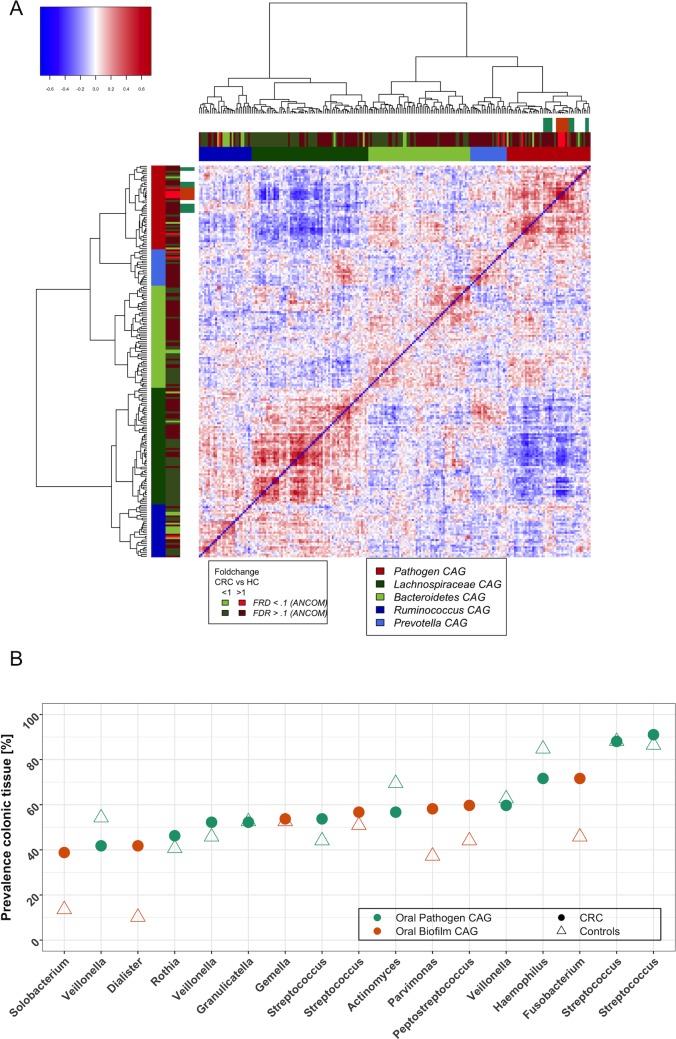
Oral bacterial colonisation of human CRCs is negatively associated with the colonic mucosal abundance of the Lachnospiraceae CAG. (A) The relative abundance of oral pathogens at colonic lesions (found mostly in bright red CAG) is negatively correlated with the relative abundance of OTUs clustered in a CAG mainly comprising Lachnospiraceae (Lachnospiraceae CAG; dark green CAG). Shown is the heatplot of the correlation values between OTUs detected at colonic mucosal surfaces. CAGs were defined on the basis of the clusters in the vertical or horizontal trees and named after their most notable characteristic. Column and row bars indicate bacterial CAGs (as per legend to the bottom right), fold change between individuals with CRC and healthy controls (as per legend to the bottom left) and bacterial CAGs determined with only the subset of 17 OTUs found both at colonic and oral mucosal surfaces (figure 3A). Legend top left: colour-scale correlation coefficient. (B) Scatterplot of the colonic prevalence of bacterial OTUs associated with oral pathogen and biofilm CAGs (figure 3A). Most OTUs were only detected on a subset of CRCs and polyps (circle) or healthy controls (triangle). CAGs, coabundance groups; CRCs, colorectal cancer; OTUs, operational taxonomic units.

