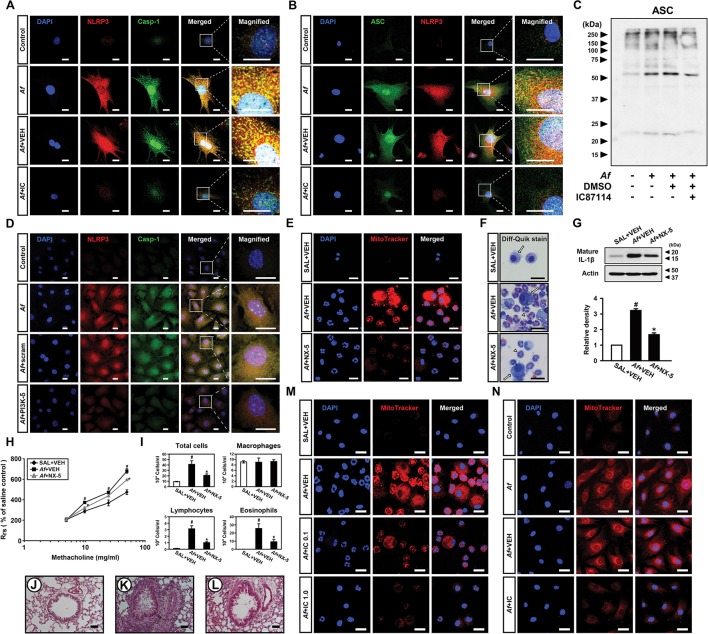
Figure 4.
Aspergillus fumigatus (Af)-induced nucleotide-binding domain, leucine-rich-containing family, pyrin-domain-containing-3 (NLRP3) inflammasome assembly/activation is regulated by phosphoinositide 3-kinase (PI3K)-δ in epithelial cells (EpCs). (A and B) Representative confocal images of tracheal EpCs show the localisation of NLRP3 (red), caspase-1 (Casp-1; green) and apoptosis-associated speck-like protein containing a carboxy-terminal caspase-recruitment domain (ASC; green) in the control (no treatment), Af-stimulated cells (Af), Af-stimulated cells administered drug vehicle (Af+VEH), and Af-stimulated cells administered IC87114 (Af+IC). 4',6-Diamidino-2-phenylindole (DAPI) stain was used for nuclear localisation. Bars indicate 20 µm. (C) Representative immunoblot of ASC monomers and high order complexes in cross-linked cytosolic pellets from Af-stimulated EpCs in the presence and absence of IC87114. (D) Representative confocal images of tracheal EpCs show the localisation of NLRP3 (red) and Casp-1 (green) in the control (no treatment), Af-stimulated cells (Af), Af-stimulated cells administered scrambled siRNA (Af+Scram), or Af-stimulated cells administered PI3K-δ siRNA (Af+PI3K-δ). Bars indicate 20 µm. (E) Representative confocal images show the localisation of mitochondrial ROS (mtROS) in bronchoalveolar lavage (BAL) cells from saline-exposed mice administered drug vehicle (SAL+VEH), Af-exposed mice administered drug vehicle (Af+VEH), or Af-exposed mice administered NecroX-5 (Af+NX-5). Bars indicate 20 µm. (F) Cellular changes in BAL fluids of Af-exposed mice. Arrows and arrowheads indicate macrophages and eosinophils, respectively. Bars indicate 20 µm. (G) Representative immunoblots and densitometric analyses of IL-1β in lung tissues. Bars represent mean±SEM from seven mice per group. #P<0.05 versus SAL+VEH; *P < 0.05 versus Af+VEH. (H) Airway responsiveness assessed by invasive measurements from SAL+VEH, Af+VEH or Af+NX-5. Bars represent mean±SEM from six mice per group. (I) Cellular changes in bronchoalveolar lavage fluids. Bars represent mean±SEM from six mice per group. #P<0.05 versus SAL+VEH; *P < 0.05 versus Af+VEH. (J–L) Representative H&E stained sections of the lung from SAL+VEH (J), Af+VEH (K) and Af+NX-5 (L). Bars indicate 50 µm. (M) Representative confocal images show the localisation of mtROS in BAL cells from saline-exposed mice administered drug vehicle (SAL+VEH), Af-exposed mice administered drug vehicle (Af+VEH), Af-exposed mice administered 0.1 mg/kg IC87114 (Af+IC 0.1) or Af-exposed mice administered 1.0 mg/kg IC87114 (Af+IC 1.0). Bars indicate 20 µm. (N) Representative confocal images of tracheal EpCs show the localisation of mtROS in the control, Af, Af+VEH and Af+IC. Bars indicate 10 µm.

