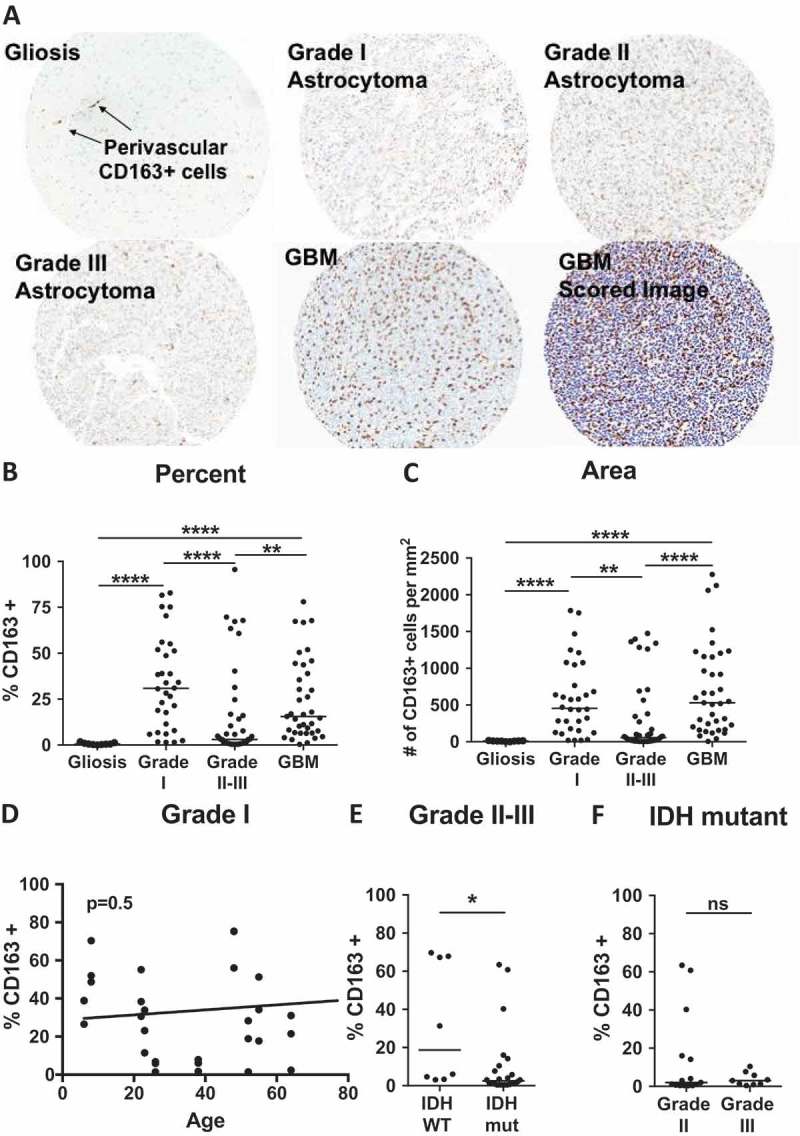
Figure 1.

CD163 is elevated in grades I and IV astrocytoma. (A) Representative cores from gliosis, grade I, II, III and GBM TMAs stained for CD163. Bottom right image is an example image scored by InForm software, where blue indicates nuclei, and brown indicates CD163+ cells. (B-C) Quantitative analysis of TMAs represented as (B) % of total cells that are CD163+, or (C) number of CD163+ cells per square millimeter. P-values calculated with the Kruskal–Wallis one-way ANOVA followed by Dunn’s multiple comparisons test. (D) Linear regression analysis of patient age versus CD163 positivity in grade I pilocytic astroctyomas. P-value 0.5 indicates the slope does not significantly deviate from zero. (E) Comparison CD163 infiltration in IDH wild-type versus mutant samples from grade II-III astrocytomas. (F) Comparison CD163 infiltration in grade II versus III astrocytomas among IDH mutant samples. P-values were calculated with the Mann-Whitney test. Statistical significance is denoted with an asterisk where * = p < 0.05, ** = p < 0.01, *** = p < 0.001, **** = p < 0.0001. Line indicates median.
