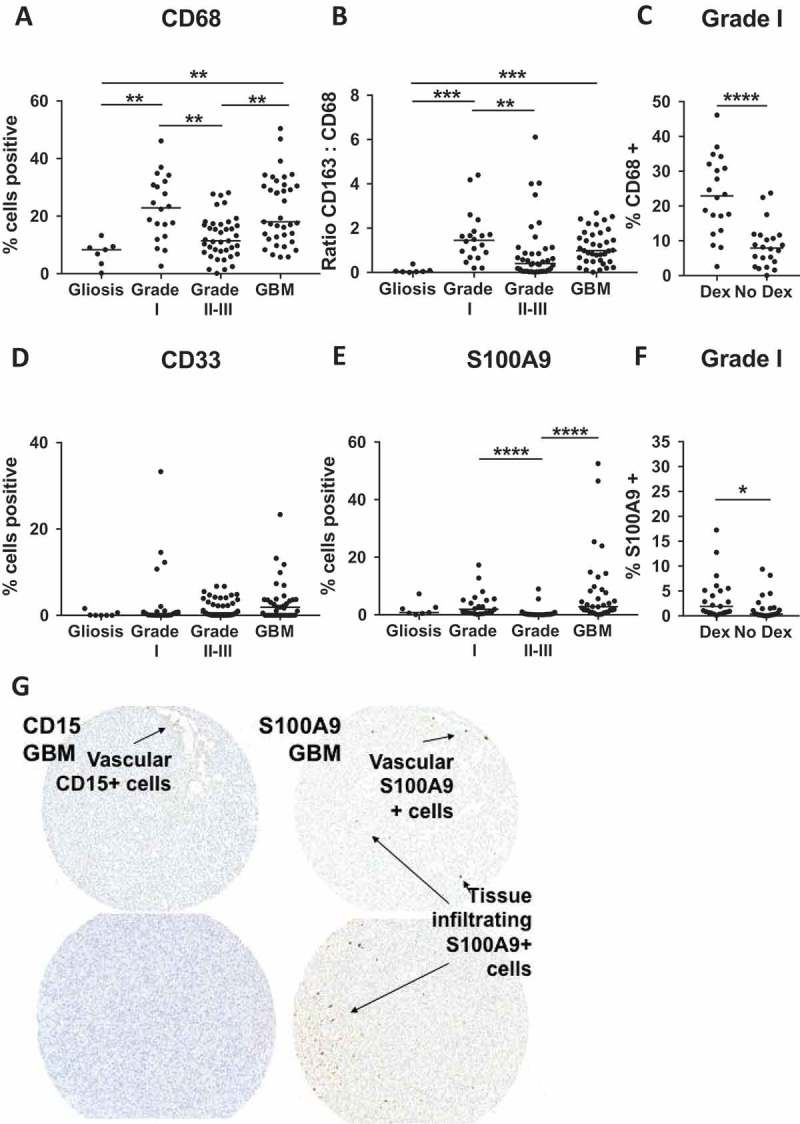
Figure 3.

CD68, CD33, S100A9 are not associated with high grade disease. (A) Quantitative analysis of TMAs represented as % of total nuclei that are CD68 + . (B) Ratio of CD163 to CD68 positivity calculated from adjacent TMA sections. (C) Comparison of CD68 positivity in Dex-treated and Dex-naïve samples from grade I astrocytoma patients. Quantitative analysis of TMAs represented as % of total cells that are (D) CD33+ and (E) S100A9 + . (F) Comparison of S100A9 positivity in Dex-treated and Dex-naïve samples from grade I astrocytoma patients. (G) CD15 (left images) S100A9 (right images) showing vascular CD15+ neutrophils, and both vascular and tumor infiltrating S100A9+ cells. Images from left to right were taken from serial sections. Statistical significance is denoted with an asterisk where * = p < 0.05, ** = p < 0.01, *** = p < 0.001, **** = p < 0.0001. Line indicates median.
