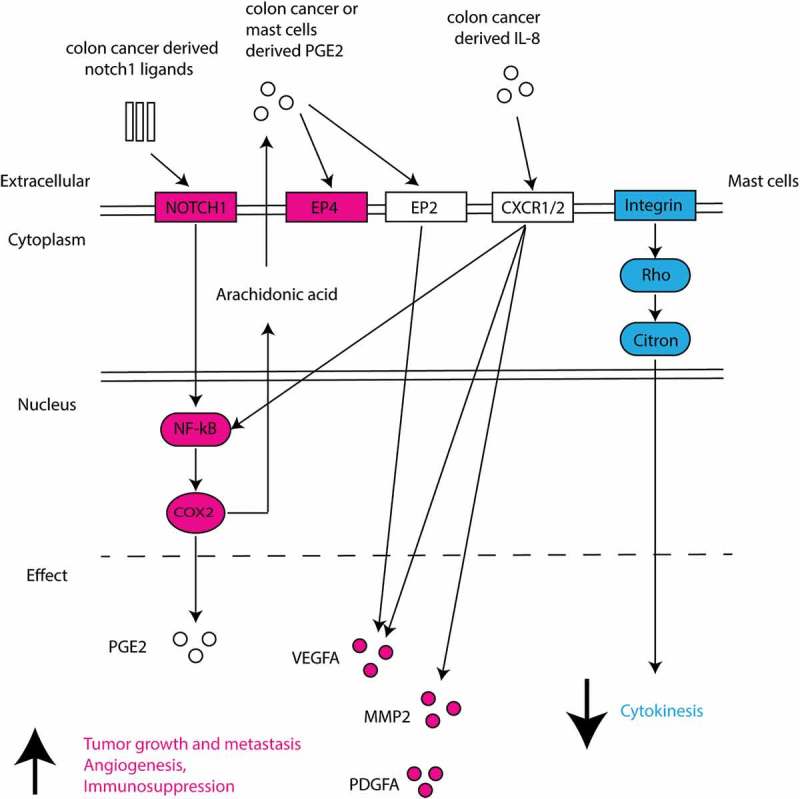
Figure 8.

Schematic overview of deregulated genes and associated pathways in colon cancer-cocultured MC.
Differentially upregulated genes are shown in red and downregulated genes in blue. Predicted pathways and effects are presented.

Schematic overview of deregulated genes and associated pathways in colon cancer-cocultured MC.
Differentially upregulated genes are shown in red and downregulated genes in blue. Predicted pathways and effects are presented.