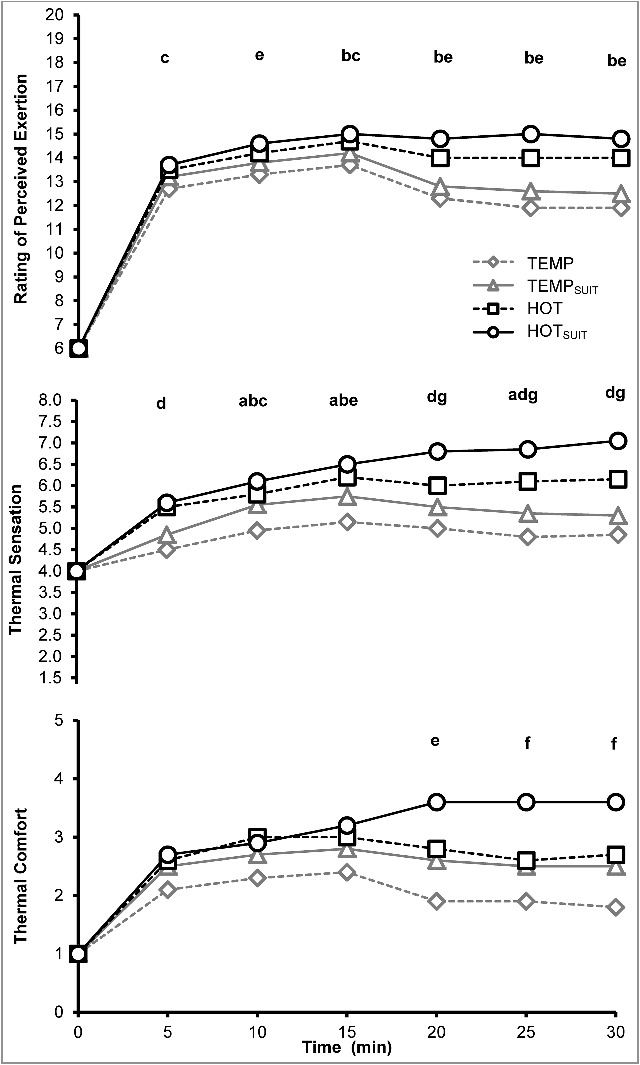
Figure 2.

Mean perceptual measurements, rating of perceived exertion (Top), thermal sensation (Middle) and thermal comfort (Bottom) during 30-mins of exercise in TEMP, TEMPSUIT, HOT and HOTSUIT conditions. SD has been removed for clarity. Letters indicate statistical difference (P<0.05) whereby; a: TEMP vs. TEMPSUIT, b: TEMP vs. HOT, c: TEMP vs. HOTSUIT, d: TEMP, TEMPSUIT vs. HOT, HOTSUIT, e: TEMP, TEMPSUIT vs. HOTSUIT, f: TEMP, TEMPSUIT, HOT vs. HOTSUIT, g: HOT vs. HOTSUIT.
