Figure 5.

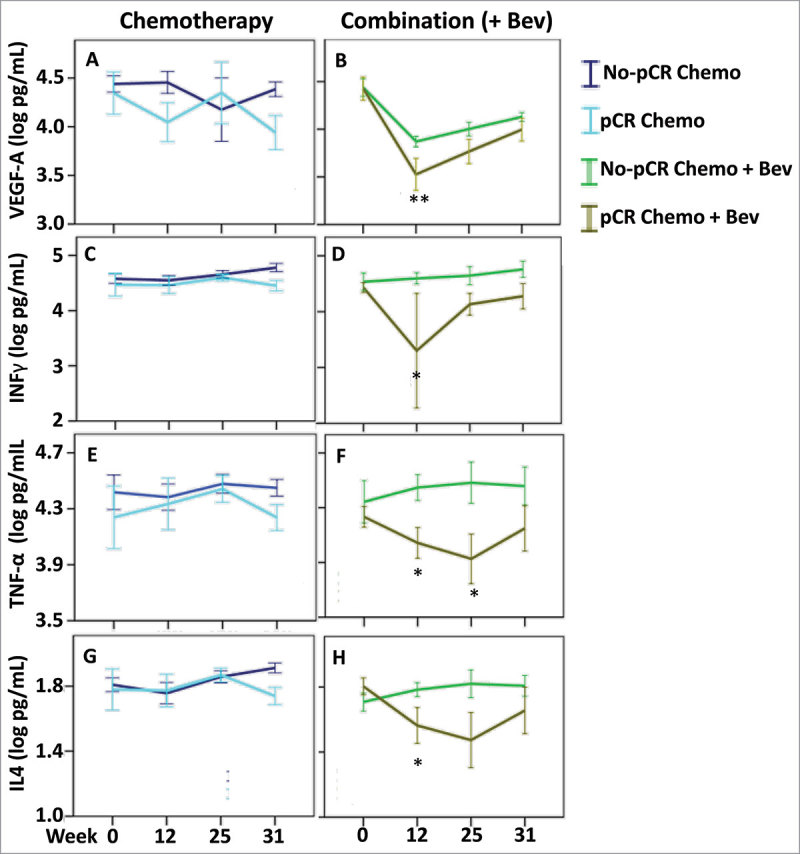
Cytokine levels associated with pathological complete response. Cytokine levels were assessed in the patients with pathological complete response in both treatment arms: chemotherapy (left panel) and combination arm (right panel). To find the most relevant and significant differences between responders and non-responders, we first tested for global differences using ANOVA (Table 3) and only for the significant values (ANOVA P < 0.05) that also showed a significant result in the global three-way ANOVA (FDR-adjusted P < 0.1) (and TNF-alpha), we further tested for significant difference at each time point using t-test. (A & B) VEGF-A, (C & D) IFN-γ, (E & F) TNF-α and (G & H) IL4, we found a global difference between responders and non-responders in the combination arm (ANOVA P < 0.05) and further identified significant differences at the indicated time points. * P < 0.05, ** P < 0.01. Error bars represent ± 1 standard deviation.
