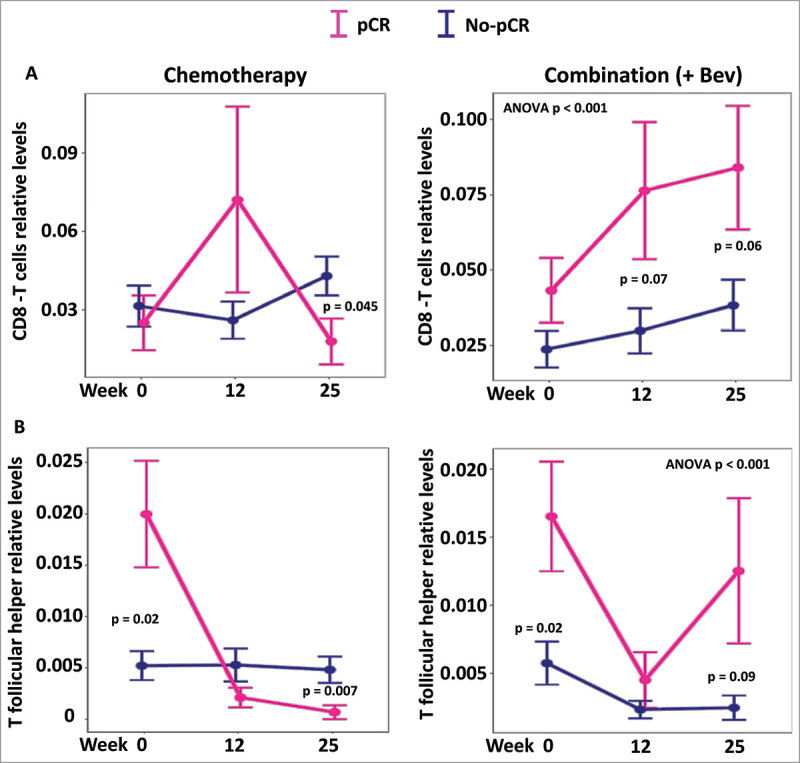
Figure 6.

Levels of CD8T and T follicular helper cells according to response and treatment. Levels of infiltrating CD8T cells and T follicular helper cells were inferred using CIBERSORT and expression levels. In both treatment arms levels of CD8T cells and T follicular helper are plotted at the different time points (screening, 12 and 25 weeks). The global levels of CD8 and follicular T cells appeared significantly different only in the combination (+Bev) arm (ANOVA P < 0.001 in both cases).
