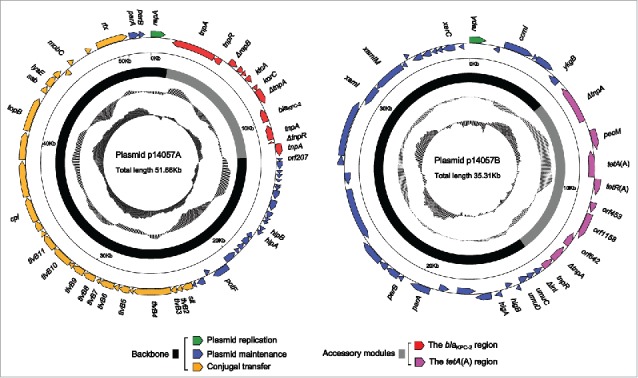
Figure 1.

Schematic map of p14057A and p14057B. Genes are denoted by arrows, and the backbone and accessory module regions are highlighted in black and color, respectively. The innermost circle presents GC-skew [(G-C)/(G+C)], with a window size of 500 bp and a step size of 20 bp. The next-to-innermost circle presents GC content. Shown also are backbone and accessory modules.
