Figure 1.

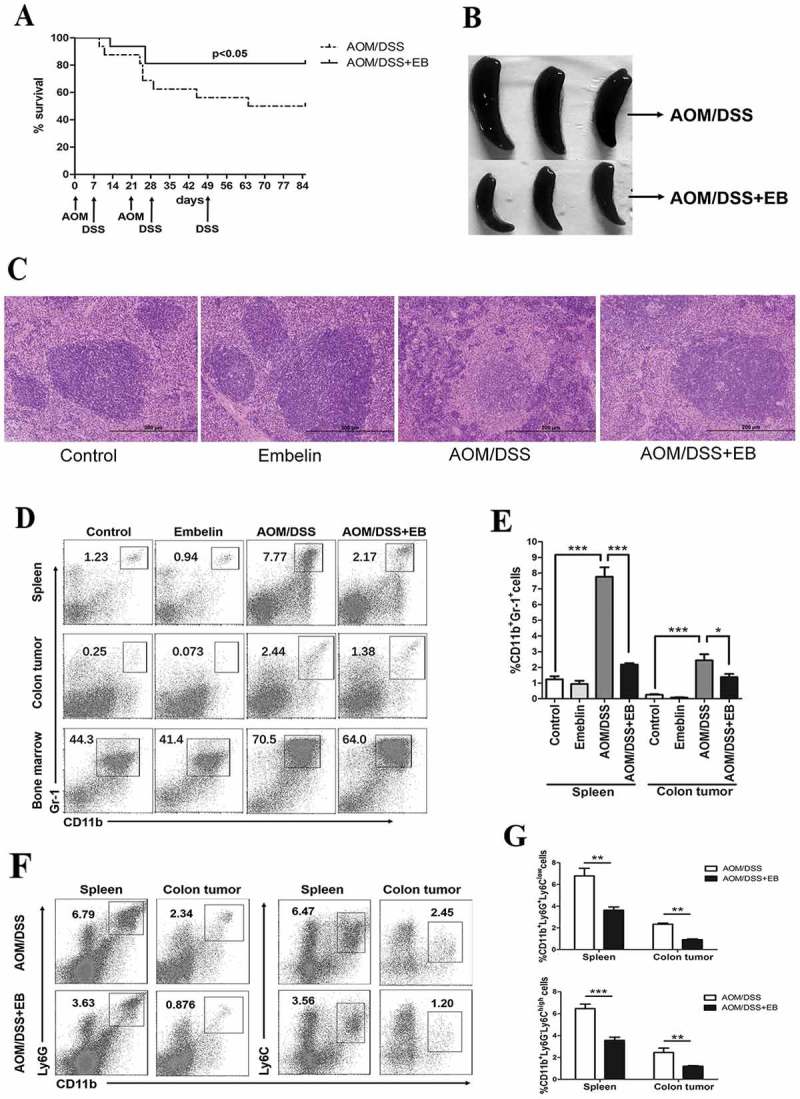
Embelin (EB) decreases accumulation of MDSCs in CAC-bearing mice.
CAC model was established by using AOM/DSS. A. Kaplan-Meier plot of survival of mice treated with or without embelin during CAC development (n = 16 per group). B. Representative images of spleens harvested from mice. C. Representative hematoxylin and eosin (H&E)-stained sections of spleens from indicated group of mice. Scale bar, 200 μm. D. The immunocytes isolated from indicated organs were subjected to flow cytometry at day 85 of CAC establishment. The dot plots shown were gated on the viable cells, CD11b and Gr-1 flow plots were used to identify MDSCs. E. Data represents the percentage of MDSCs (CD11b+Gr-1+) in total viable cells from spleen and colon tumor. F. The subpopulation of PMN-MDSCs (CD11b+Ly6G+Ly6Clow) and M-MDSCs (CD11b+Ly6G−Ly6Chigh) in spleen and colon tumor of embelin-treated or untreated CAC mice. G. Data represents the percentage of PMN-MDSCs and M-MDSCs in total viable cells. All quantitative data are expressed as mean ± SD (n = 6 per group). *P < 0.05, **P < 0.01, ***P < 0.001.
