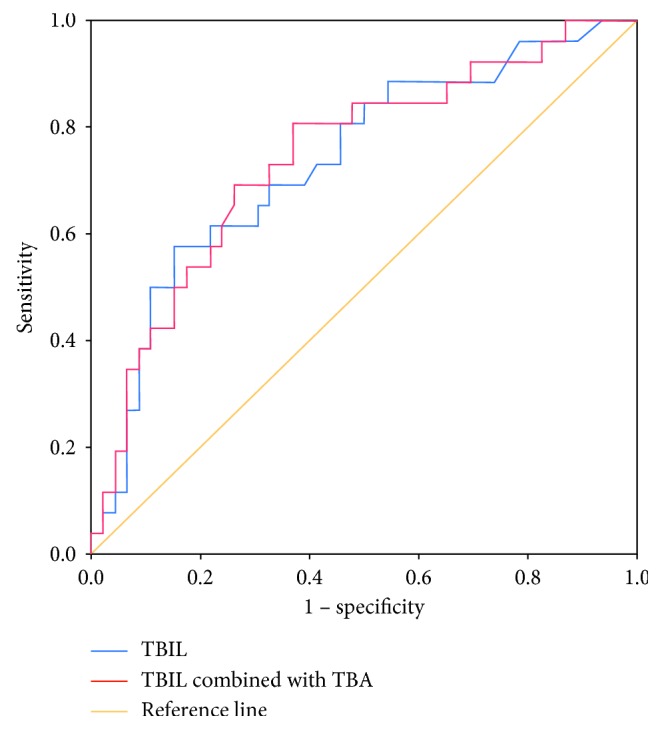
Figure 2.

Receiver-operating characteristic (ROC) curves for the prognosis of the pediatric patients with SALI. TBIL is presented as a blue line, TBIL combined with TBA as a red line, and reference value as a brown line. The area under the ROC curve (AUC) for TBIL and TBIL combined with TBA is 0.736 (0.614–0.858) and 0.745 (0.626–0.865), respectively.
