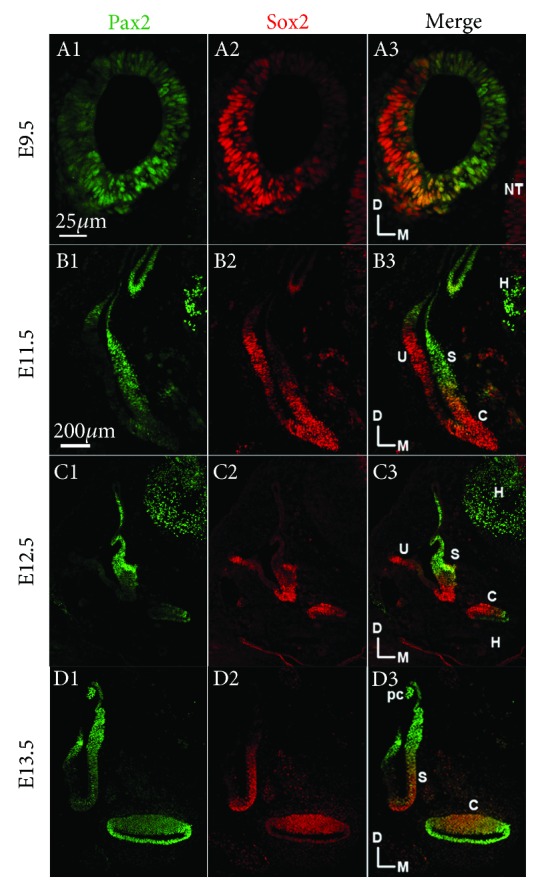
Figure 1.

Comparison of Pax2, Sox2 expression in the inner ear from E9.5 to E13.5. Immunofluorescence staining of Sox2 (red), Pax2 (green), and Prox1 (green) in the mouse inner ear at E9.5, E11.5, E12.5, and E13.5. S: saccule; U: utricle; C: cochlea; D: dorsal; M: medial; pc: posterior crista; H: hindbrain; NT: neural tube. Scale bars = 25 μm (A1–A3); 200 μm (B1–B3, C1–C3, and D1–D3).
