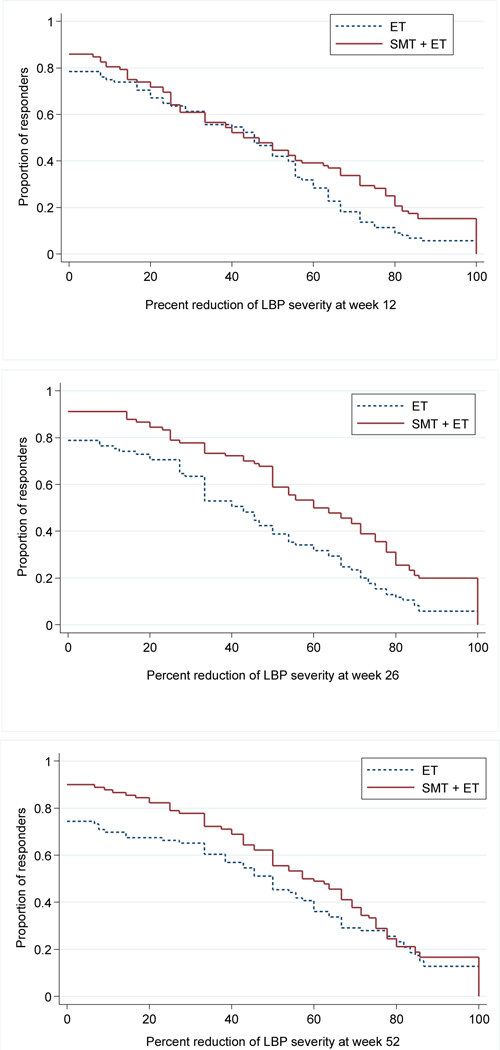
Figure 3.

Cumulative Responder Analyses – The y-axis displays the proportion of participants who reported a percent reduction in pain severity from baseline equal to or greater than the value on the x-axis.

Cumulative Responder Analyses – The y-axis displays the proportion of participants who reported a percent reduction in pain severity from baseline equal to or greater than the value on the x-axis.