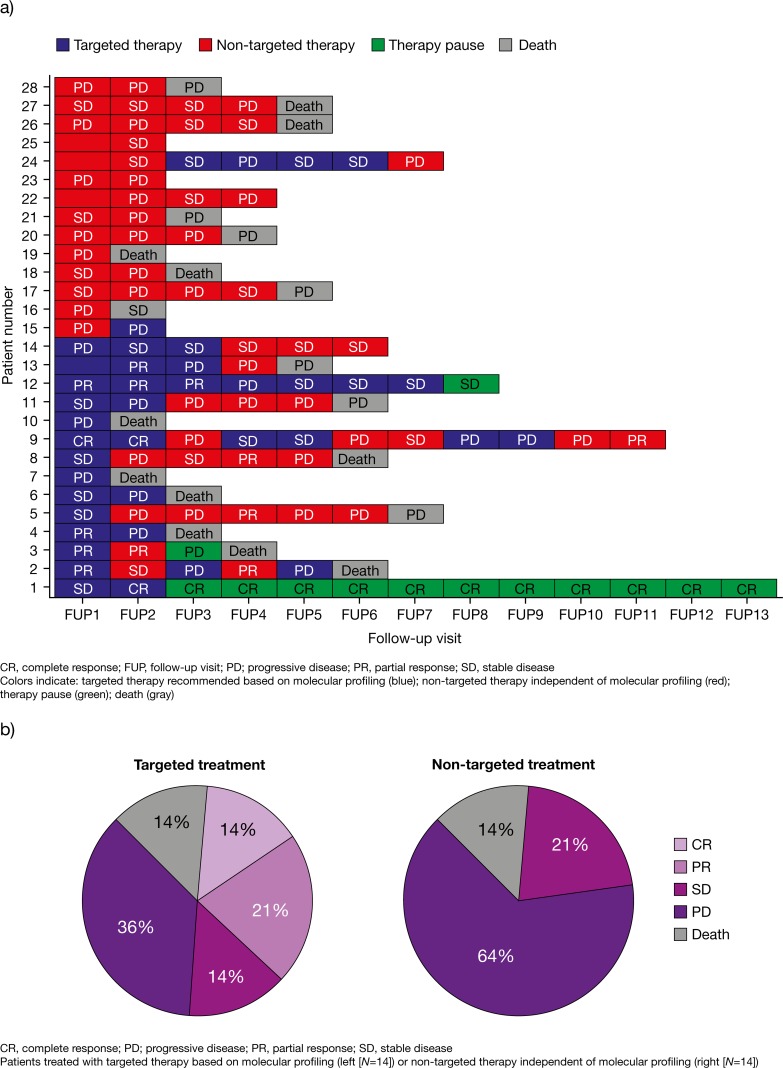
Figure 3.
Disease outcome relating to treatment at each follow-up visit (a) and tumor response after six months (b) in all evaluated patients (N=28). Diagram of all 28 evaluated patients in relation to their follow-up frequency. The first follow-up (FUP1) was raised three months after report generation and was requested in three months intervals. Blue bars: Recommended drugs were considered during follow-up interval. Red bars: Patient was treated with other drugs than recommended. Green bars: Therapy was interrupted. Grey bars: Patient died. Response to treatment in each interval is described by abbreviations: Stable disease/Minor response (SD), Partial Response (PR), Complete Response (CR) and Progressive Disease (PD) (a). Pie chart of treatment response after six months in the second follow-up interval (FUP2). The left panel shows the response of 14 patients to treatment following the targeted treatment recommendation, while the right panel shows the response of the remaining 14 patients to other treatments. The following abbreviations were used: Progressive Disease (PD), Stable Disease/Minor Response (SD), Partial Response (PR), Complete Response (CR) (b).

