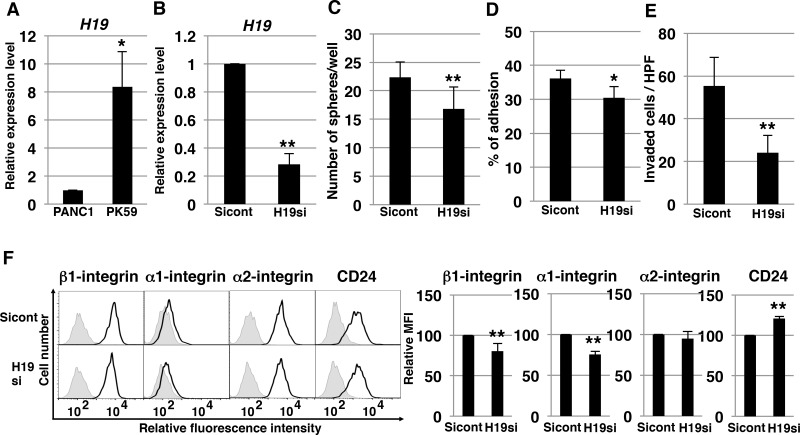
Figure 9. H19-knockdown effect on PK-59 PDAC cells.
(A) qRT-PCR analysis of H19 was performed using cDNA derived from PANC-1 and PK-59 cells. *P < 0.05. (B) qRT-PCR analysis of H19 was performed using cDNA derived from Sicont and H19-knockdown (H19si) PK-59 cells. Results are normalized relative to the values obtained for sicont cells (value = 1). **P < 0.01. (C) Results of sphere-formation assays showing decreased sphere formation by H19-knockdown (H19si) PK-59 cells. **P < 0.01. (D) Adhesion assays were performed on Sicont and H19-knockdown (H19si) PK-59 cells. *P < 0.05. (E) Matrigel invasion assays were performed on Sicont and H19-knockdown (H19si) PK-59 cells. **P < 0.01. (F) Flow-cytometry analysis of integrin and CD24 levels in Sicont and H19-knockdown (H19si) PK-59 cells. Controls are indicated by thin lines with gray color. MFIs relative to Sicont cells are shown on the right side. Results are presented as means ± SD from three independent experiments. **P < 0.01.

