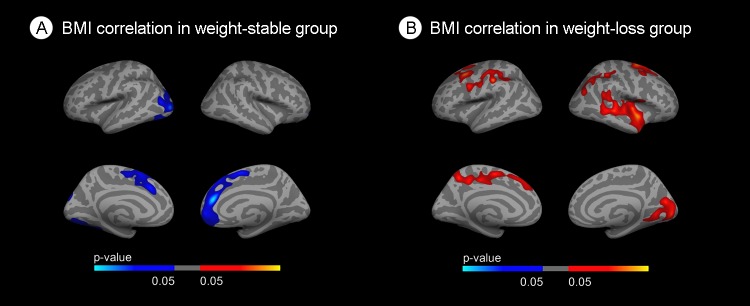
Figure 2. Stratified correlation analysis between body mass index and cortical thickness.
(A) Correlation between BMI and cortical thickness in the weight-stable group. (B) Correlation between BMI and cortical thickness in the weight-loss group. Blue areas indicate regions with significant (FWE<0.05) cortical thinning. Red areas represent areas with significant cortical thickening (FWE<0.05). The blue and red gradient colors represent the uncorrected p-values (p<0.05) in the FWE suriving clusters only.

