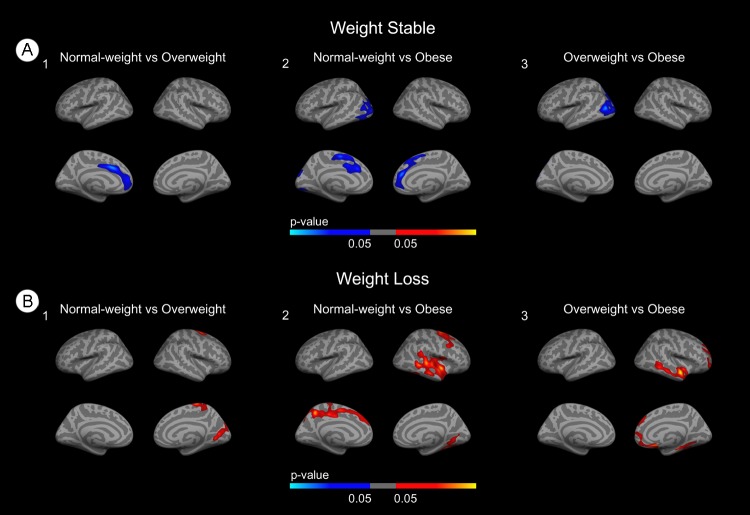
Figure 3. Stratified group comparisons between BMI groups.
(A) Group comparisons in the weight-stable group. (B) Group comparisons in the weight-loss group. Blue areas indicate regions with significant (FWE<0.05) cortical thinning. Red areas represent areas with significant cortical thickening (FWE<0.05). The blue and red gradient colors represent the uncorrected p-values (p<0.05) in the FWE surviving clusters only.

