Figure 1.
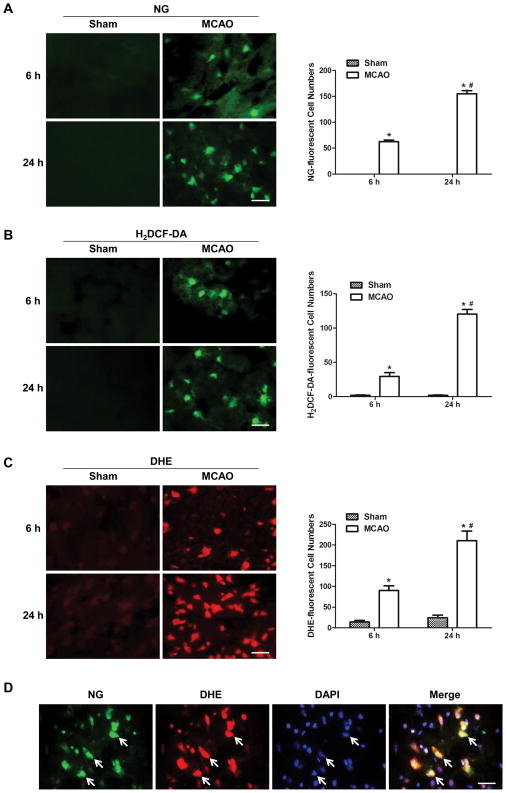
Cytosolic labile zinc accumulation and ROS formation increased with time after ischemia and colocalized in the penumbra tissue of MCAO rats. Representative staining with NG (A), a fluorescent Zn2+ indicator; H2DCF-DA (B), a fluorescent ROS indicator, and DHE (C), another fluorescent ROS indicator, of brain sections at 6 and 24h after reperfusion. Quantification of NG-, H2DCF-DA- and DHE-stained cells are shown to the right of the corresponding images. Data are means±SD (n=5). *P<0.05 vs sham group, #P<0.05 vs vehicle-treated MCAO 6h group. (D) Double staining of ischemic brain sections of ischemic rats after 24-hour reperfusion with NG (green) and DHE (red). White arrows indicate cells labeled with NG, DHE, or double labeled with both. Bars=20μm.

