
Figure 1.
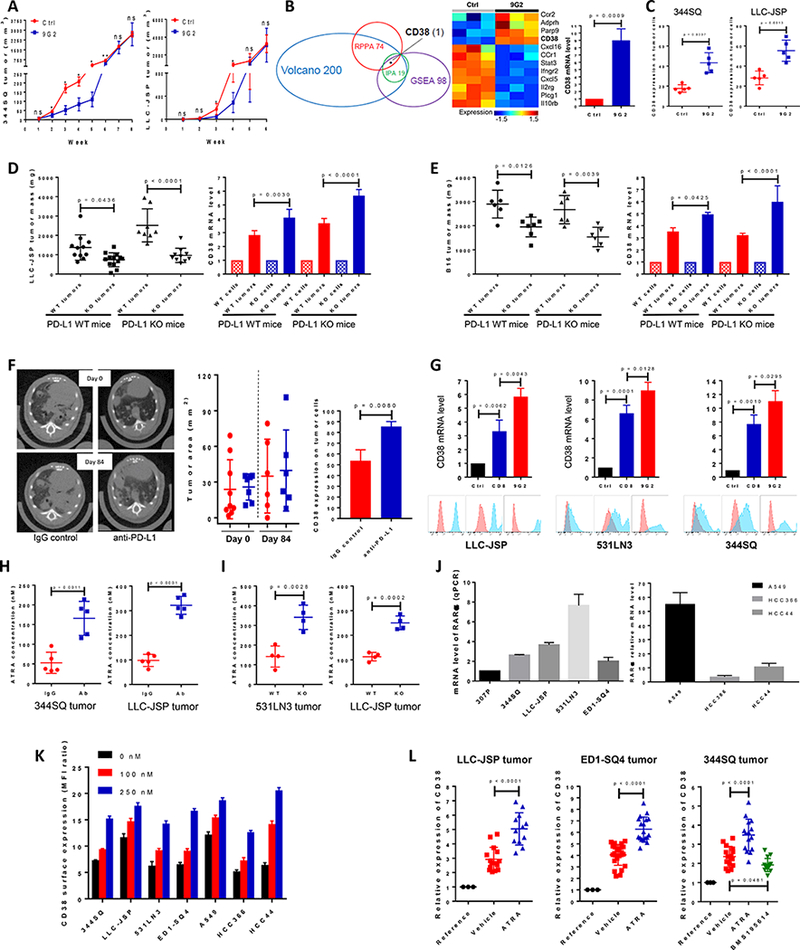
PD-1/PD-L1 blockade resistance results from CD38 up-regulation due to the enrichment of ATRA in tumors.
(A) (Left panel) anti-PD-L1 antibody or an IgG control was injected into 129/Sv mice (200 μg; intraperitoneally) once a week for 7 weeks beginning on day 7 after 344SQ tumor cells were subcutaneously implanted (1 × 10⁶ cells per mouse). Tumors were measured once a week for 8 weeks. The tumor growth curve is shown, with tumor sizes (n = 6 or 7) presented as mean ± SEM. ns, no significant difference, *p < 0.05, **p < 0.01. (Right panel) anti-PD-L1 antibody or an IgG control was injected into C57BL/6 mice (200 μg; intraperitoneally) once a week for 5 weeks beginning on day 7 after the subcutaneous implantation of LLC-JSP tumor cells (0.5 × 10⁶ cells per mouse). Tumors were measured once a week for 6 weeks. The tumor growth curve is shown, with tumor sizes (n = 10 or 11) presented as mean ± SEM. ns, no significant difference, *p < 0.05.
(B) (Left panel) Venn diagram of genes changed upon anti-PD-L1 antibody treatment in 344SQ tumors (n = 3) at week 5. The top 100 up-regulated genes and top 100 down-regulated genes were included from the Volcano plot analysis, 98 genes involved in T cell activity from Gene Set Enrichment Analysis (GSEA), and the top 19 networks identified with Ingenuity Pathway Analysis (IPA) software. 74 protein markers involved in immune signaling pathways, cell cycle signaling, tumor metabolism signaling were included for RPPA. CD38 is the only molecule overlapping in all 4 analyses. (Middle panel) Heat map showing differentially expressed mRNAs related to CD38 from the two profiled groups. (Right panel) Relative CD38 mRNA levels in sorted 344SQ tumor cells (CD31-CD45-EpCAM+ for sorting) were quantified by qPCR assays using the tumor samples at week 5 (n = 3) from the control and anti-PD-L1 groups. mRNA levels are normalized to L32.
(C) 344SQ tumors in Figure 1A were harvested and CD38 expression on sorted tumor cells was analyzed by FACS at week 5, and represented in the left panel. LLC-JSP tumors in Figure 1A were harvested and CD38 expression on tumor cells was analyzed by FACS at week 4, and represented in the right panel.
(D) In immune competent C57BL/6 PD-L1 WT mice (n = 11 or 13), Lewis lung LLC-JSP cells with wildtype PD-L1 or PD-L1 KO (0.5 × 10⁶ cells per mouse) were subcutaneously injected. Mice were sacrificed 4 weeks post-injection. The primary tumor mass is shown in the left panel, presented as mean ± SEM. CD38 mRNA levels quantified with qPCR assay in sorted tumor cells are shown in the right panel. In C57BL/6 PD-L1 KO mice (n = 8 or 10), Lewis lung LLC-JSP cells with wildtype PD-L1 or PD-L1 KO (1 × 10⁶ cells per mouse) were subcutaneously injected. Mice were sacrificed 4 weeks post-injection. The primary tumor mass is shown in the left panel, with tumor sizes presented as mean ± SEM. CD38 mRNA levels quantified with qPCR assay in sorted tumor cells are shown in the right panel. mRNA levels are normalized to L32. ANOVA test was used to analyze.
(E) In immune competent C57BL/6 PD-L1 WT mice (n = 6 or 7), melanoma B16 cells with wildtype PD-L1 or PD-L1 KO (2 × 10⁶ cells per mouse) were subcutaneously injected. Mice were sacrificed 4 weeks post-injection. The primary tumor mass is shown in the left panel, presented as mean ± SEM. CD38 mRNA levels quantified with qPCR assay in sorted tumor cells are shown in the right panel. In C57BL/6 PD-L1 KO mice (n = 6), melanoma B16 cells with wildtype PD-L1 or PD-L1 KO (2 × 10⁶ cells per mouse) were subcutaneously injected. Mice were sacrificed 4 weeks post-injection. The primary tumor mass is shown in the left panel, presented as mean ± SEM. CD38 mRNA levels quantified with qPCR assay in sorted tumor cells are shown in the right panel. mRNA levels are normalized to L32. ANOVA test was used to analyze.
(F) K-rasLA1/+p53R172HΔg/+ mice were intraperitoneally injected with anti-PD-L1 antibody (200 μg per mouse) or an isotype-matched IgG control once a week for 12 weeks. The initial lung tumor area measured by micro-CT was ~28 mm2 in each group, with representative sections shown in the left panel. Tumors were monitored by micro-CT scanning and plots of tumor size at indicated times are shown in the middle panel (red dots, IgG control group; blue squares, anti-PD-L1 group). Representative histograms of CD38 expression on tumor cells (CD31-CD45-EpCAM+) at the endpoint are shown in the right panel.
(G) Indicated cancer cells (0.5 × 10⁶ cells per mouse) were subcutaneously injected into mice to challenge and activate T cells. Tumors, blood, spleen were harvested to isolated CD8 T cells 2 weeks post-injection. 2000 cancer cells were co-cultured with 0.1 million CD8 T cells in the presence of anti-CD3 (5 μg/ml) and anti-CD28 (5 μg/ml) or in the presence of anti-CD3 (5 μg/ml), anti-CD28 (5 μg/ml), and anti-PD-L1 (20 μg/ml) for 3 days. The non-adherent CD8 T cells were washed away and cancer cells were harvested for qRT-PCR and FACS analysis. The experiments were repeated three times. Data was analyzed using ANOVA test.
(H) The indicated tumor-bearing mice were treated with anti-PD-L1 antibody (Ab) or an IgG control (IgG) (200 μg; intraperitoneally) once a week for 4 weeks beginning on day 7 after tumor cells were subcutaneously implanted (1 × 10⁶ cells per mouse). The tumors were harvested to measure the concentration of ATRA on week 5 after tumor cell inoculation. Tumor lysates were used to measure the concentration of ATRA using the Thermo Orbitrap Fusion Tribrid Mass Spectrometer. The concentrations of ATRA in tumors are presented as mean ± SD with p values.
(I) Tumors were harvested on week 5 after PD-L1WT531LN3, PD-L1KO531LN3, PD-L1WTLLC-JSP, PD-L1KOLLC-JSP cells (1 × 10⁶ cells per mouse) were subcutaneously implanted into syngeneic mice. Tumor lysates were used to measure the concentration of ATRA using the Thermo Orbitrap Fusion Tribrid Mass Spectrometer. The concentrations of ATRA in tumors are presented as mean ± SD with p values.
(J) The retinoic acid receptor alpha (RARα) mRNA levels in a panel of lung cancer cell lines (Left panel: murine cancer lines; right panel: human cancer lines) was measured by qPCR assays. mRNA levels were normalized to L32. The summarized data from three independent experiments are shown.
(K) Cells were incubated with ATRA at different concentrations (0 nM, 100 nM, and 250 nM) for 3 days and stained with anti-CD38 antibody for FACS analysis. CD38 surface expression was quantified by the ratio of mean fluorescence intensity (MFI). The experiments were repeated three times.
(L) The indicated tumor-bearing mice (LLC-JSP bearing C57BL/6 mice; ED1-SQ4 bearing FVB mice; 344SQ bearing 129/Sv mice) were treated with vehicle, ATRA (45 μg in 100 μl 1% methylcellulose; oral administration) or RARα antagonist BMS195614 (67 μg in 100 μl 1% methylcellulose; oral administration) once a day for 2 weeks beginning on day 4 after tumor cells were subcutaneously implanted (1 × 10⁶ cells per mouse). At the endpoint, CD38 mRNA levels in sorted tumor cells were measured by qPCR assays. The respective parental cell lines were included as the reference. mRNA levels were normalized to L32. The summarized data from three independent experiments are shown with p values calculated by ANOVA test. Reference, cell line; Vehicle, sorted tumor cells from control vehicle treated tumors; ATRA, sorted tumor cells from ATRA treated tumors; BMS195614, sorted tumor cells from BMS195614 treated tumors.