
Figure 3.
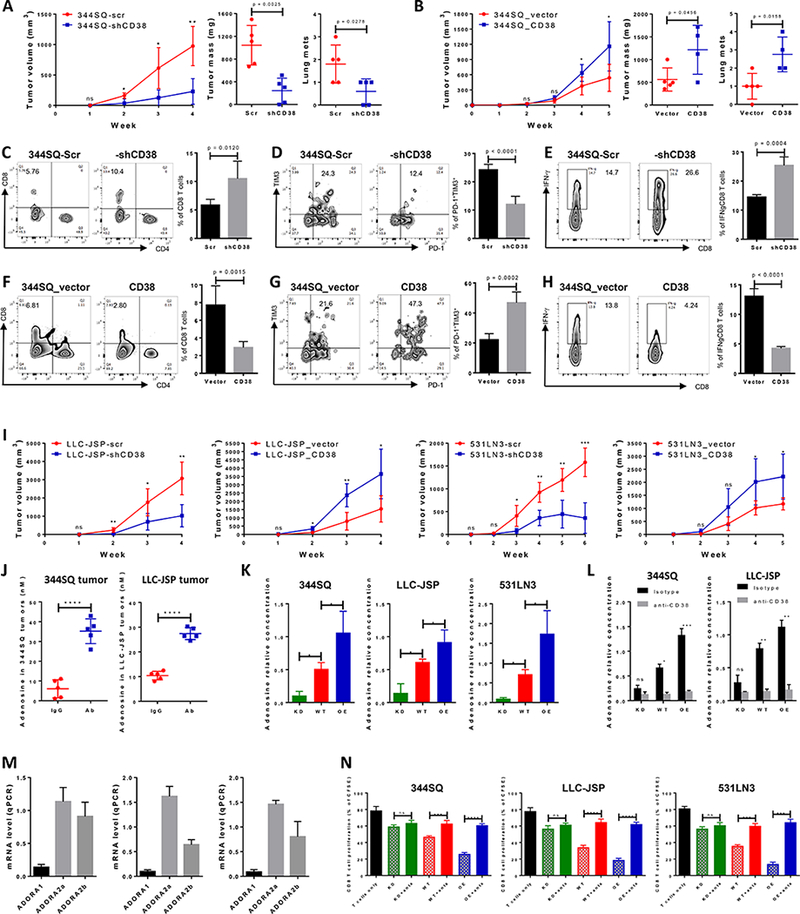
CD38 regulates tumor growth and metastasis by adenosine-mediated CD8+ T cell suppression.
(A) 344SQ-scr or 344SQ-shCD38 cells (2 × 10⁶ cells per mouse) were subcutaneously injected into immune competent 129/Sv mice (n = 5). Tumor size was measured weekly and tumor growth curves are shown in the left panel, with tumor sizes presented as mean ± SEM. ns, no significant difference, *p < 0.05, **p < 0.01. The primary tumor mass and lung metastatic nodules are shown in the middle and right panels 4 weeks post-injection.
(B) 344SQ_vector or 344SQ_CD38 cells (1 × 10⁶ cells per mouse) were subcutaneously injected into immune competent 129/Sv mice (n = 5). Tumor size was measured weekly and tumor growth curves are shown in the left panel, with tumor sizes presented as mean ± SEM. ns, no significant difference, *p < 0.05. The primary tumor mass and lung metastatic nodules are shown in the middle and right panels 5 weeks post-injection.
(C-E) At the endpoint, CD8+TILs in primary tumors (344SQ-scr or 344SQ-shCD38) were analyzed by FACS and are shown in (C). The percent of exhausted CD8+ T cells measured by PD-1+TIM3+ is shown in (D). The percent of antitumor IFN-γ+CD8+ T population is shown in (E). Representative plots of individual tumor are shown on the left and bar graphs of the summary data for all tumors on the right (n=5/group).
(F-H) At the endpoint, CD8+TILs in primary tumors (344SQ_vector or 344SQ_CD38) were analyzed by FACS and are shown in (F). The percent of exhausted CD8+ T cells measured by PD-1+TIM3+ is shown in (G). The percent of antitumor IFN-γ+CD8+ T population is shown in (H). Representative plots of individual tumor are shown on the left and bar graphs of the summary data for all tumors on the right (n=5/group).</p/.(I) Indicated isogenic cancer cells (1 × 10⁶ cells per mouse for LLC-JSP-scr or LLC-JSP-shCD38 injection; 0.5 × 10⁶ cells per mouse for LLC-JSP_vector or LLC-JSP_CD38 injection; 2 × 10⁶ cells per mouse for 531LN3-scr, 531LN3-shCD38, 531LN3_vector, or 531LN3_CD38 injection) were subcutaneously injected into the syngeneic mice. Tumor sizes were measured weekly and tumor growth curves are shown. Tumor sizes are presented as mean ± SEM. t-test is used to analyze the difference. ns, no significant difference, *p < 0.05, **p < 0.01, ***p < 0.001.
(J) The indicated tumor-bearing mice were treated with anti-PD-L1 antibody (Ab) or an IgG control (IgG) (200 μg; intraperitoneally) once a week for 4 weeks beginning on day 7 after tumor cells were subcutaneously implanted (1 × 10⁶ cells per mouse). Tumor lysates were used to measure the concentration of adenosine using the Agilent Triple Quad (QQQ) 6460 Mass Spectrometer. The concentrations of adenosine in tumors are presented as mean ± SD. ****p < 0.0001.
(K) 1 × 10⁶ of indicated cells were cultured in 100 mm tissue culture dishes for 3 days. Cells were then treated for 30 min with 100 μM adenosine deaminase inhibitor EHNA before being cultured in the presence of 50 μM NAD+. Supernatants were collected after 1 hour incubation with NAD+ for determining adenosine concentration by Mass Spectrometry. The data from triplicates are shown as mean ± SEM. *p < 0.05, **p < 0.01, ***p < 0.001. ANOVA test was used to analyze. KD, CD38 knockdown; WT, CD38 wildtype; OE, CD38 overexpression.
(L) 1 × 10⁶ of indicated cells were cultured in the presence of anti-CD38 (30 μg/ml) or isotype control for 3 days. Cells were then treated for 30 min with 100 μM adenosine deaminase inhibitor EHNA before being cultured in the presence of 50 μM NAD+. Supernatants were collected after 1 hour incubation with NAD+ for determining adenosine concentration by Mass Spectrometry. The data from triplicates are shown as mean ± SEM. ANOVA test was used to analyze. ns, no significance, *p < 0.05, **p < 0.01, ***p < 0.001. KD, CD38 knockdown; WT, CD38 wildtype; OE, CD38 overexpression.
(M) 1 × 10⁶ of tumor cells (left panel for 344SQ, middle panel for LLC-JSP, and right panel for 531LN3 respectively) were subcutaneously injected into syngeneic mice. 2 weeks later, CD8+ T cells were sorted from tumors for determining mRNA level of adenosine receptors ADORA1, ADORA2a, and ADORA2b by qPCR assays. mRNA levels were normalized to L32. The experiments were repeated three times.
(N) To prepare tumor specific CD8+ T cells, syngeneic immune competent mice were challenged with 0.5 × 10⁶ tumor cells for 2 weeks. CD8+ T cells were isolated from these tumors, blood, and spleens. CFSE-labeled CD8+ T cells were co-cultured with indicated cancer cells in the presence of anti-CD3 (5 μg/ml) and anti-CD28 (5 μg/ml) for 4 days. As indicated, the cocktail of specific adenosine receptor antagonists (500 nM ADORA1 antagonist PSB36, 1 μM ADORA2a antagonist SCH58261, and 1 μM ADORA2b antagonist PSB1115) was used to block adenosine receptor signaling. CD8+ T cells only was included as the control. T cell proliferation was quantified using FACS analysis. The pooled data from three independent experiments are shown as mean ± SEM. ns, no significant difference, **p < 0.01, ***p < 0.001, ****p < 0.0001. ANOVA test was used to analyze. KD, CD38 knockdown; WT, CD38 wildtype; OE, CD38 overexpression; anta, indicates the addition of the antagonist cocktail against ADORA1, ADORA2a, and ADORA2b.