Figure 5.

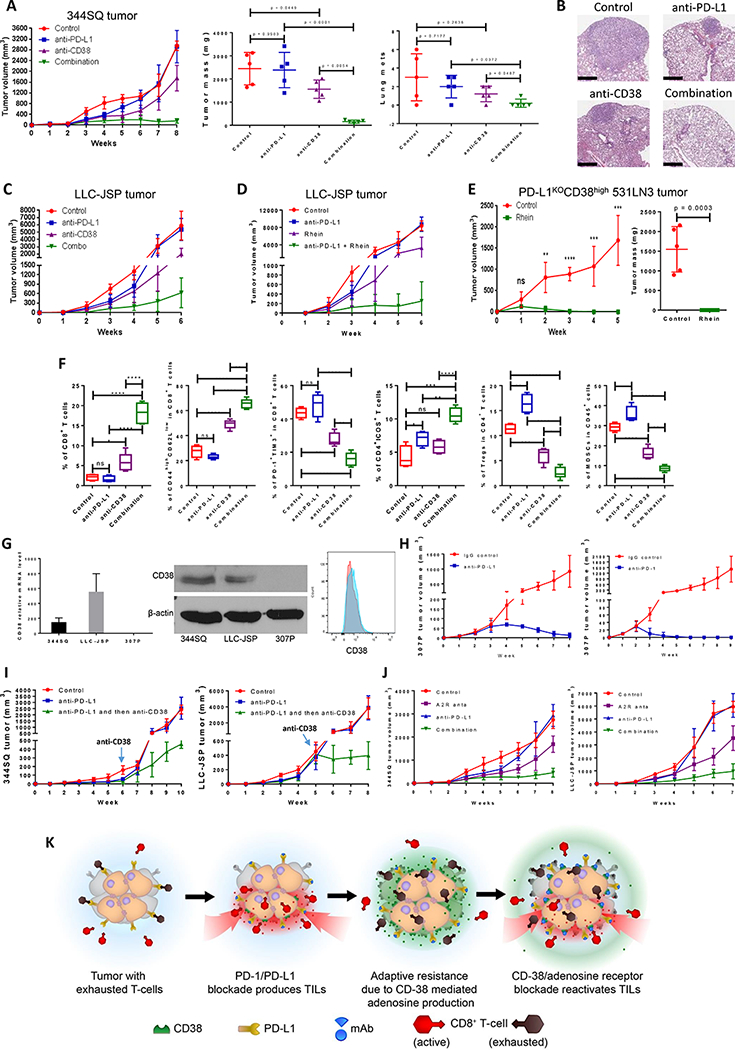
Co-inhibition of PD-L1 and CD38 or adenosine signaling improves antitumor immune responses.
(A) The indicated antibody or the isotype-matched IgG control was injected into 129/Sv mice (intraperitoneally) once a week for 7 weeks beginning on day 7 after subcutaneous 344SQ tumor cell injection (1 × 10⁶ cells per mouse; n = 5/group). Dosing per injection was 200 μg of anti-PD-L1, 250 μg of anti-CD38. Tumors were measured once a week for 8 weeks. The tumor growth curves are shown in the left panel. The final tumor weights and metastatic lung nodules are shown in the middle and right panel. p values were calculated with ANOVA test.
(B) Representative H & E-stained lung tissues from each group of Figure 5A are shown, indicating metastatic nodules. Scale bars represent 600 μm.
(C) The indicated antibody was injected into C57BL/6 mice (intraperitoneally) once a week for 5 weeks beginning on day 7 after the subcutaneous LLC-JSP tumor cell injection (1 × 10⁶ cells per mouse). Dosing per injection was 200 μg of anti-PD-L1, 250 μg of anti-CD38. Combo represents the combination of 200 μg anti-PD-L1 and 250 μg of anti-CD38. Tumors were measured once a week for 6 weeks. The tumor growth curves are shown.
(D) C57BL/6 mice were treated with anti-PD-L1 and Rhein (CD38 inhibitor) once a week for 5 weeks beginning on day 7 after the subcutaneous LLC-JSP tumor cell injection (1 × 10⁶ cells per mouse). Dosing per intraperitoneal injection was 200 μg of anti-PD-L1, 50 mg/kg of Rhein. Tumors were measured once a week for 6 weeks. The tumor growth curves are shown (n = 5/group).
(E) PD-L1KOCD38high531LN3 cells (2 × 10⁶ cells per mouse) were subcutaneously injected into immune competent 129/Sv mice (n = 5/group). Mice were treated with Rhein (CD38 inhibitor) once a week for 4 weeks beginning on day 1 after tumor cell injection. Dosing per intraperitoneal injection was 50 mg/kg. Tumors were measured once a week for 5 weeks. The tumor growth curves are shown in the left panel and the final tumor weights are shown in the right panel. Tumor sizes are presented as mean ± SEM. ns, no significant difference, **p < 0.01, ***p < 0.001, ****p < 0.0001.
(F) FACS analysis of CD4+ICOS+TIL and CD8+TIL frequency, percent of memory CD8 T cells and exhausted CD8 T cells, and tumor-infiltrating Tregs and MDSCs from the endpoint primary tumors of Figure 5A. The statistical summary is shown. ns, no significant difference, **p < 0.01, ***p < 0.001, ****p < 0.0001. p values were calculated with ANOVA test. The gating strategies are included in the legend of Supplemental Figure S20.
(G) (Left) CD38 mRNA levels in murine lung cancer cell lines 344SQ, LLC-JSP, and 307P were determined by qPCR assays. mRNA levels are normalized to L32. The experiments were repeated at least three times. (Middle) CD38 protein levels in murine lung cancer cell lines 344SQ, LLC-JSP, and 307P were determined by Western blotting. β-actin was used as the loading control. (Right) 4 × 10⁶ of 307P cells were subcutaneously injected into 129/Sv mice (n = 3). CD38 expression on sorted 307P tumor cells (CD31-CD45-EpCAM+ for sorting) was determined by FACS analysis 2 weeks post-cancer cell injection. The representative histogram is shown. Red, isotype staining; Light blue, CD38 staining.
(H) 129/Sv mice were treated weekly with anti-PD-L1 (200 μg per mouse), anti-PD-1 (200 μg per mouse), or their IgG control beginning on day 7 after a subcutaneous 307P cancer cell injection (4 × 10⁶ cells per mouse; n = 5 or 7) for indicated weeks. The tumor growth was monitored once a week. The tumor growth curves are shown.
(I) (Left) 129/Sv mice were treated weekly with anti-PD-L1 (200 μg per mouse) or IgG control (Control) beginning on day 7 after a subcutaneous 344SQ cancer cell injection (0. 05 × 106 cells per mouse; n = 5) for 6 weeks. Mice in one of anti-PD-L1 treatment groups were sequentially treated with anti-CD38 (250 μg per mouse) once a week for 4 weeks. The tumor growth was monitored once a week. The tumor growth curves are shown. (Right) C57BL/6 mice were treated weekly with anti-PD-L1 (200 μg per mouse) or IgG control (Control) beginning on day 7 after a subcutaneous LLC-JSP cancer cell injection (0. 05 × 106 cells per mouse; n = 5) for 5 weeks. Mice in one of anti-PD-L1 treatment groups were sequentially treated with anti-CD38 (250 μg per mouse) once a week for 3 weeks. The tumor growth was monitored once a week. The tumor growth curves are shown.
(J) 200 μg of anti-PD-L1 antibody or the isotype-matched IgG control was intraperitoneally injected into mice (n = 5 or 7) once a week, while A2R anta (2 mg/kg of SCH 58261 and 1 mg/kg of PSB 1115) in 100 μl of carrier solution were intraperitoneally injected every other day, for indicated weeks beginning on day 7 after subcutaneous tumor cell injection (1 × 10⁶ cells per mouse). The mice in control group received both IgG control and carrier solution. Tumors were measured once a week and the tumor growth curves are shown. A2R anta: adenosine receptor 2 antagonists; SCH 58261: A2a adenosine receptor antagonist; PSB 1115: A2b adenosine receptor antagonist.
(K) The working model of CD38 as a major mechanism of the resistance to PD-1/PD-L1 blockade.
